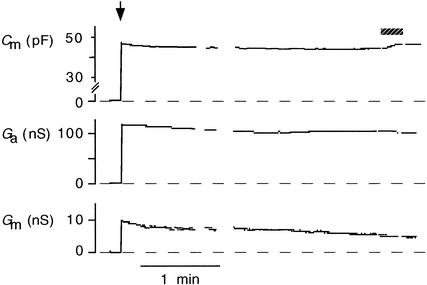
Figure 1.
Time Course of Membrane Capacitance, Access Conductance, and Membrane Conductance of a Coleoptile Protoplast during Perfusion of the Cytoplasm with a Pipette Solution Containing Low [Ca2+]cyt.
The arrow marks the time of breaking into whole-cell configuration. During the time indicated by the shaded bar, the protoplast was illuminated by UV380 to release Ca2+ from the caged precursor. Dashed lines indicate zero values for electrical variables. Ga, access conductance. pF, picofarad; nS, nanosimens, i.e., gigaohm−1.

