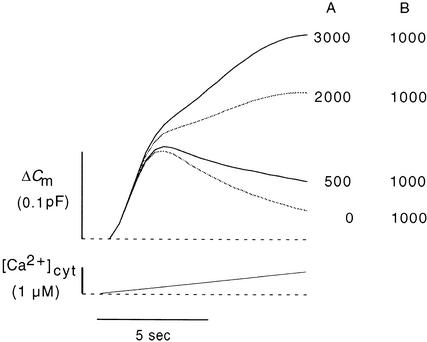
Figure 12.
Simulation of CARC during Ramp Increases of [Ca2+]cyt.
Membrane capacitance curves (top) were calculated for linear [Ca2+]cyt ramping (bottom) based on the model presented in Figure 11A and the rate constants from Table 1. Curves were calculated for different numbers of vesicles in pools A or B or both. The numbers of vesicles in the pools are given at right.

