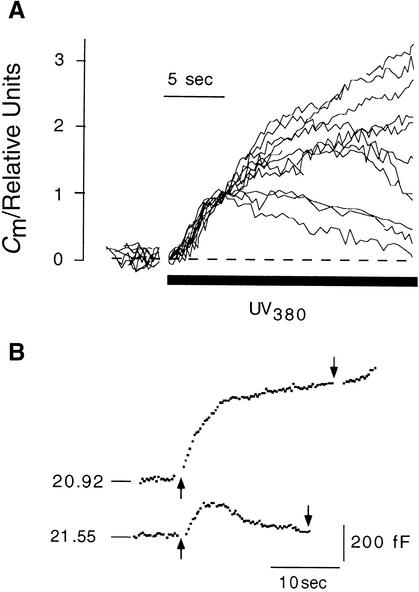
Figure 5.
Protoplast-to-Protoplast Variability in Changes in Cm Values Stimulated by Ramp Elevation of [Ca2+]cyt.
(A) Membrane capacitance responses were determined from 11 protoplasts when [Ca2+]cyt was increased in a ramplike fashion from 4 nM at a mean rate of 0.6 ± 0.25 μmol L−1 sec−1.
(B) Two membrance capacitance responses stimulated by ramp elevation of [Ca2+]cyt in the same protoplast. The time gap between stimulations was 169 sec. The time of illumination with UV light is marked by arrows. Numbers on membrane capacitance traces denote resting values in picofarads. Scale bars denote time in seconds and Cm values in femtofarads.

