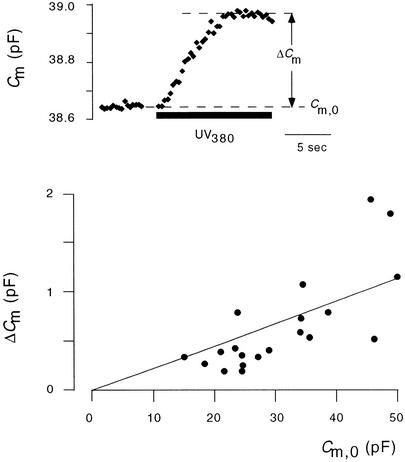
Figure 8.
Amplitude of CARC as a Function of the Resting Capacitance before Stimulation.
In experiments in which ramp elevation of Ca2+ caused an increase in Cm values with a clear saturation (see inset, top), the amplitude, ΔCm, was measured and plotted versus the Cm,0 value that was measured before Ca2+ stimulation. Linear fit (line) of data through the origin has a slope of 2.4%.

