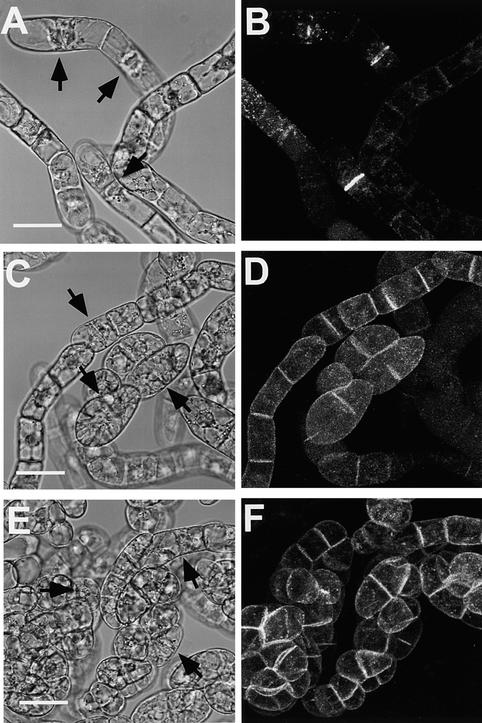
Figure 7.
Localization of m6- and m7-GFP in Tobacco BY2 Cells.
(A), (C), and (E) Bright-field images of BY2 cells expressing wild-type or mutant KOR1-GFP fusion proteins.
(B), (D), and (F) Confocal images of the same cells. Other technical details as in Figure 6.
(A) and (B) KOR1-GFP transgenic cells.
(C) and (D) m7-GFP transgenic cells.
(E) and (F) m6-GFP transgenic cells.
The cell plates are indicated by arrows. Bars in (A), (C), and (E) = 50 μm for (A) to (F).

