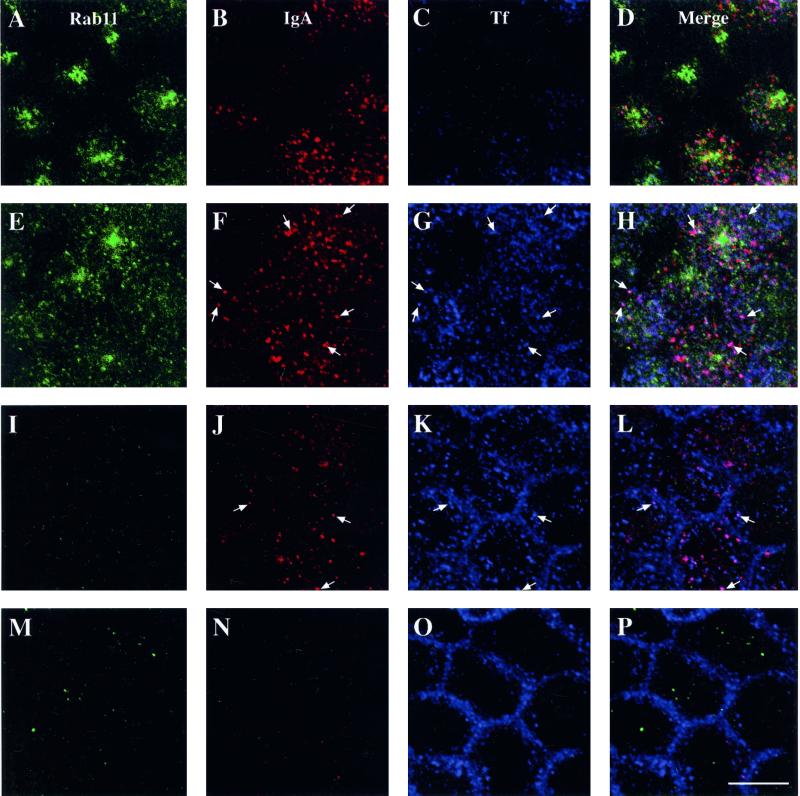
Figure 10.
Distribution of Tf, IgA-labeled AEE, and Rab11 in polarized MDCK cells. Tf was internalized from the basolateral poles of the cells for 30 min at 37°C. During the last 2.5 min of this internalization period, IgA was added to the apical poles of the cells. At the end of the experiment, the cells were rapidly chilled, cell surface IgA was removed by trypsin treatment, and the cells were fixed with the use of a pH-shift protocol. The cells were incubated with primary antibodies directed against Rab11, IgA, or Tf and then reacted with either CY5-, CY3-, or FITC-labeled secondary antibodies. The FITC signal (in green) is shown in the left panels, the CY3 signal (in red) is shown in the center left panels, the CY5 signal (in blue) is shown in the center right panels, and merged images of the FITC, CY3, and CY5 signals are shown in the right panels. Single optical sections, obtained with a confocal microscope, are shown from the apex of the cell (A–D), at or near the level of the tight junctions (E–H), directly above the nucleus (I–L), or along the lateral margins of the cell near its base (M–P). Note that the cells in the lower right corner of each panel are taller than the cells in the upper left corner. Regions of colocalization of IgA and Tf appear magenta in the merged images, and representative regions of colocalization are indicated by arrows. Bar, 10 μm.

