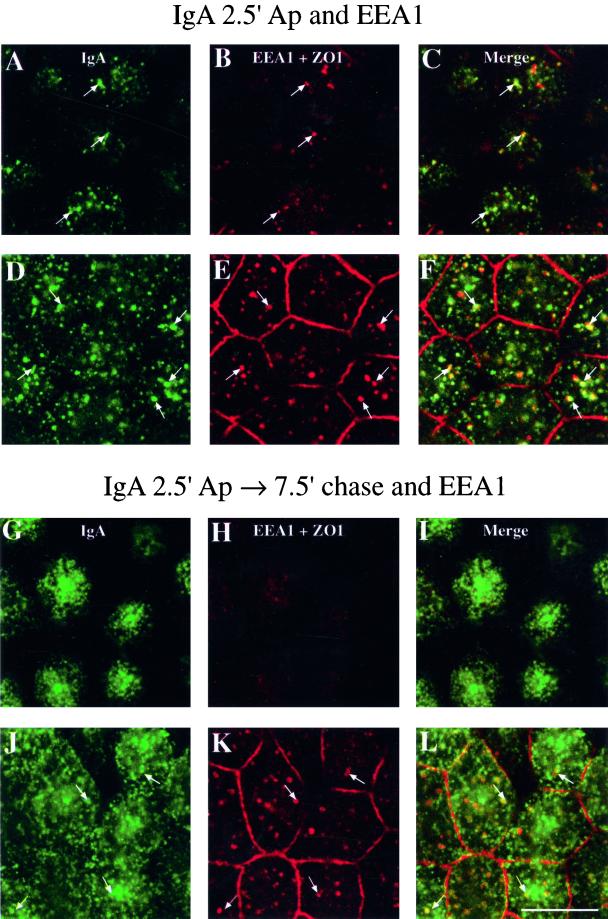
Figure 3.
Distribution of EEA1 and apically internalized IgA in polarized MDCK cells. IgA was internalized for 2.5 min at 37°C from the apical poles of MDCK cells, and the cells were either rapidly chilled (A–F) or chased in marker-free medium for 7.5 min at 37°C (G–L). After IgA internalization, the cells were rapidly cooled, cell surface IgA was removed by trypsin treatment, and the cells were fixed with the use of a pH-shift protocol. The fixed cells were incubated with primary antibodies directed against IgA, ZO1, or EEA1 and then reacted with either FITC- or CY5-labeled secondary antibodies. The FITC signal is shown in the left panels, the CY5 signal is shown in the center panels, and merged images of the FITC and CY5 signals are shown in the right panels. ZO1 appears as a thin red line at the periphery of each cell. Single optical sections, obtained with a confocal microscope, are shown from the apex of the cell (A–C and G–I) or at the level of the tight junctions (D–F and J–L). Representative regions of colocalization are marked with arrows. Bar, 10 μm.

