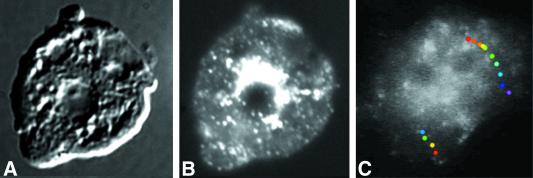
Figure 4.
Dynamic distribution of GFP-clathrin. Cells expressing GFP-clathrin were fixed and imaged with differential interference contrast (A) and fluorescence microscopy (B). (C) Single frame from images collected at 1-s intervals of a living cell expressing GFP-clathrin. Although most fluorescent spots in this cell moved relatively short distances before disappearing, occasionally fluorescent loci moved relatively long distances. Superimposed on the frame are two paths of fluorescent spots that moved long distances, shown as a series of colored dots. Each dot marks the position of fluorescent spot at 1-s intervals, with the first position marked with a red dot and the last position marked with either a blue dot (the left track) or a purple dot (the right track). These were overlaid on the single image of the cell. See accompanying video. Video is 30 times real time.

