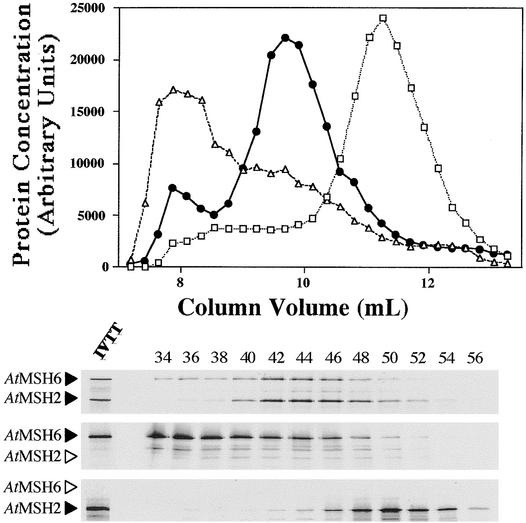
Figure 5.
Gel Filtration Chromatography Analysis of Arabidopsis 35S-Labeled Proteins.
Fifty-microliter synthesis mixture samples were layered onto the gel filtration column, fractionated, and analyzed by liquid scintillation and SDS-PAGE (see Methods).
(Top) Elution profiles for AtMSH2 (open squares), AtMSH6 (open triangles), and AtMSH2•AtMSH6 (closed circles) synthesis mixtures. Fractions 32 to 59 for each of the three mixtures are shown (elution profile).
(Bottom) Corresponding SDS-PAGE autoradiographs of the eluted fractions (even numbers 34 to 56). A small amount of the original transcription–translation synthesis reaction mixture is shown in the leftmost lane at bottom (IVTT lane). Arrowheads to the left of the gel panels denote the position expected for each polypeptide. Arrowheads in outline designate theoretical positions of polypeptides not actually present.

