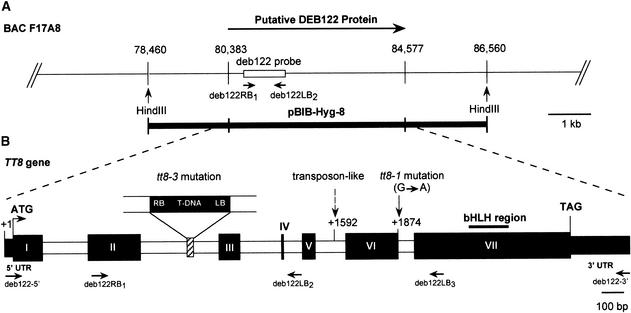
Figure 3.
Molecular Analysis of the TT8 Locus.
(A) Diagram of the DEB122 region on BAC F17A8. The arrow indicates the orientation of the putative DEB122 protein. The primers deb122RB1 and deb122LB2, used to amplify the deb122 probe, are indicated. The two HindIII restriction sites were used to generate an 8-kb genomic fragment (pBIB-Hyg-8) for complementation assays.
(B) Genomic organization of the TT8 gene (Ws-2 ecotype). The positions and relative sizes of the exons and introns of the genomic clone are indicated by black and white boxes, respectively. The respective positions of the translation start (ATG) and the translation stop (TAG) codons are shown. The solid bar represents the conserved bHLH region. The T-DNA (7 kb) is inserted into the second intron of the tt8-3 allele and causes a 29-bp deletion indicated by the striped box, whereas ethyl methanesulfonate mutagenesis causes a nucleotide transition in the sixth intron of the tt8-1 allele (shown by an arrow). The position of a transposon-like element (1.5 kb) in the Col-0 wild-type genome is shown by the dashed arrow. The primers used for molecular analyses are noted below the diagram. RB, right border; LB, left border.

