Figure 5.
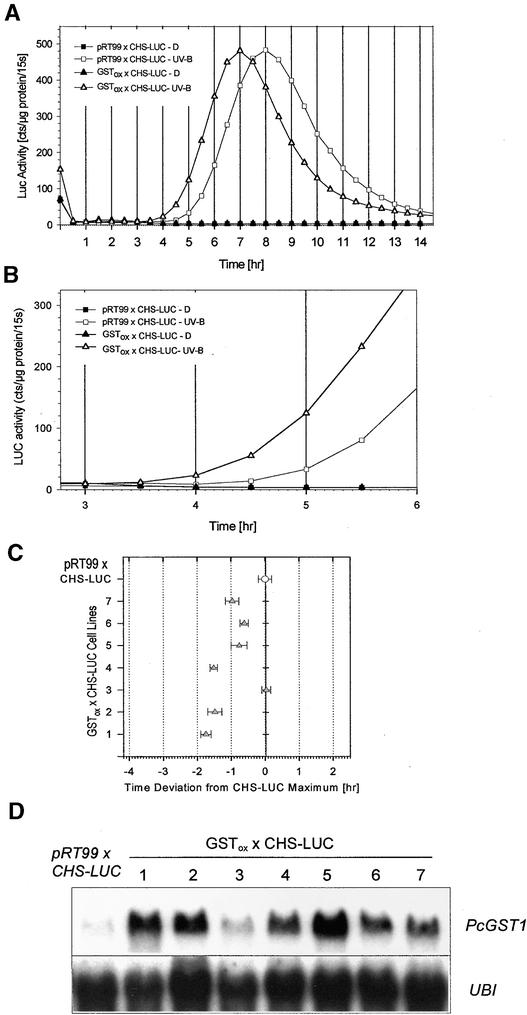
CHS-LUC Expression after UV-B Treatment and Effect of PcGST1.
(A) LUC activity of the CHS-LUC background line (pRT99 × CHS-LUC) compared with a double-transformed PcGST1 overexpressing line (GSTox × CHS-LUC). Cells of both lines were incubated in darkness (D) or irradiated with a 7-min pulse of UV-B light and subsequently transferred to darkness. Luciferin (1 mM) was added to the cells immediately after irradiation, and the actual counts for 15 sec (15s) were determined every 30 min during a 14-hr period as a measure of LUC activity. The protein concentration of each probe was determined after LUC measurement. Cts represent the amount of detected photons per time unit. LUC activity is expressed as the mean of three sample replicates from three independent experiments. Standard deviation was <15% in all cases.
(B) Section of (A) illustrating the early increase of LUC activity in pRT99 × CHS-LUC and GSTox × CHS-LUC lines after UV stimulation.
(C) LUC activity of the CHS-LUC background line (pRT99 × CHS-LUC) compared with that of seven different double-transformed lines that in addition harbor cauliflower mosaic virus 35S promoter–controlled PcGST1 cDNA (GSTox × CHS-LUC 1 to 7). Cells were treated as described in (A). The time of maximal CHS-LUC expression in the control cells was set as 0, and the deviation of maximal LUC activity from each line (1 to 7), determined in three independent experiments, was plotted in relation to it.
(D) RNA gel blot analysis of the steady state transcript amounts of PcGST1 and ubiquitin (UBI) in the background line (pRT99 × CHS-LUC) and in dark-incubated, double-transformed lines expressing PcGST1 cDNA (GSTox × CHS-LUC 1 to 7). RNA gel blot analysis was performed as given for Figure 3.

