Figure 4.
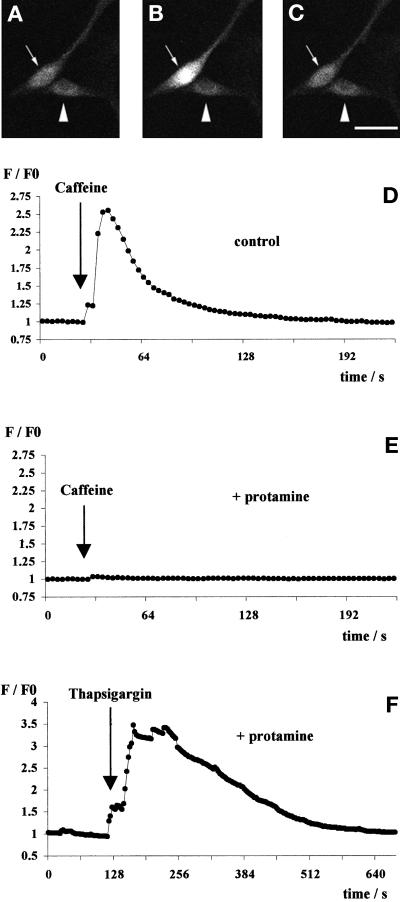
Optical recordings of intracellular calcium concentrations in differentiated C2C12 cells. Cells were loaded with fluo-3 and stimulated with caffeine, and changes in the emission wavelength maximum of fluo-3 attributable to changes in intracellular calcium concentrations were monitored. A–C show the responses of two C2C12 cells to a 20 mM caffeine stimulus. Increases in brightness represent increases in intracellular calcium concentration. (A) Baseline fluorescence of a cell injected with 50 fl of 4 mM protamine sulfate (arrowhead) and a control cell (arrow). (B) The same cells 16 s after the addition of caffeine. The intracellular calcium concentration in the control cell (arrow) increases significantly, whereas the protamine-injected cell (arrowhead) displays no significant calcium transients. (C) The cells after 38 s, with the calcium concentration of the control cell (arrow) returned to baseline levels. Scale bar in C for A–C, 50 μm. D and E show responses of two cells representative ofthe fluorescence changes measured (34 protamine-injected and 29 control-injected cells were analyzed). The application of the caffeine stimulus is indicated by arrows in D and E. Fluorescence intensity was measured as the ratio of fluorescence intensity during drug application (F) and the measured average baseline fluorescence intensity (F0). (D) A control cell responded to the addition of calcium with a typical calcium transient (1 of 29). (E) Caffeine-induced increase in intracellular calcium concentration was not observed in cells that were injected with protamine (1 of 34). In independent experiments, protamine-injected cells were tested for intact intracellular calcium stores by stimulating the release of calcium from intracellular stores with thapsigargin. Thapsigargin-induced intracellular calcium release did not differ between control-injected (n = 32), untreated (n = 54), and protamine-injected cells (n = 45). A typical thapsigargin (5 μM) response of a protamine-injected cell is shown in F. Note that the time scales in D, E, and F are different.

