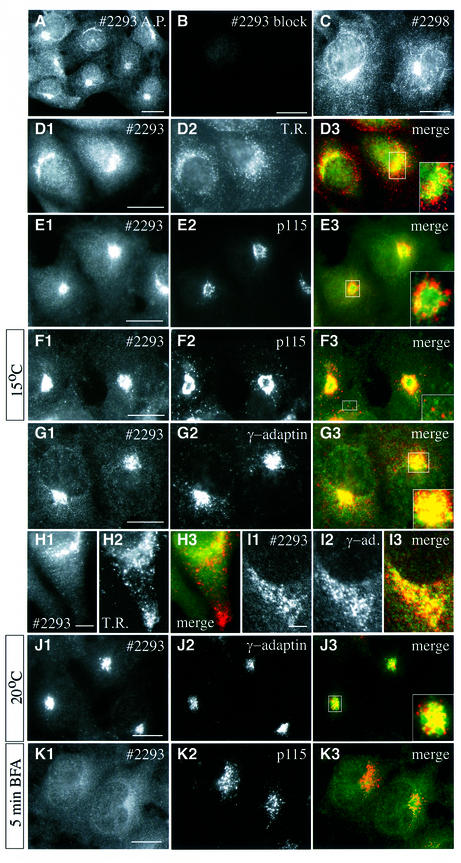
Fig. 4. Endogenous BICD2 distribution in COS-1 and HeLa cells. (A–C) COS-1 cells were fixed and processed for indirect immunofluorescence, using affinity purified (A.P.) #2293 anti-BICD2 antibodies (A), #2293 antibodies pre-incubated with GST–NBICD2 fusion protein (B) or #2298 anti-BICD2 antibodies (C). (D–K) Co-localization of BICD2 with different markers for membrane organelles. Each of the right-hand panels displays the merged signal of the left and middle images. The BICD2-specific (#2293) signal is shown in green and the corresponding marker in red. In some cases, a magnified view of the Golgi area is shown. Images were taken with an epifluorescence microscope, with the exception of H1-3 and I1-3, which were obtained with a confocal microscope. (D and H) HeLa cells, stained for BICD2 (D1, H1) and transferrin receptor (D2, H2). (E, F and K) COS-1 cells, stained for BICD2 (E1, F1, K1) and p115 (E2, F2, K2). Cells shown in F1-3 were cultured for 3 h at 15°C prior to fixation. Cells shown in K1-3 were incubated for 5 min in the presence of 5 µg/ml BFA. (G and J) COS-1 cells, stained for BICD2 (G1, J1) and γ-adaptin (G2, J2). Cells shown in J1-3 were incubated at 20°C for 3 h to block transport from the TGN. (I) HeLa cells stained for BICD2 (I1) and γ-adaptin (I2). Bars: 10 µm in (A–G), (J) and (K) and 5 µm in (H) and (I).

An official website of the United States government
Here's how you know
Official websites use .gov
A
.gov website belongs to an official
government organization in the United States.
Secure .gov websites use HTTPS
A lock (
) or https:// means you've safely
connected to the .gov website. Share sensitive
information only on official, secure websites.
