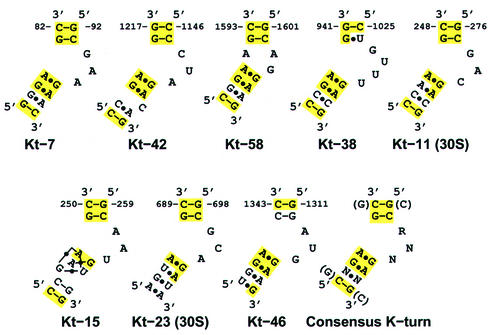
Fig. 1. Secondary structure diagrams of the eight K-turns found in the H.marismortui 50S and T.thermophilus 30S subunit structures and a derived consensus sequence. The names indicate which helix each example of the motif is found in, according to the helix numbering scheme of Leffers et al. (1987). Solid lines represent Watson–Crick pairings between bases, and black dots represent mismatched base pairings. Yellow shading indicates nucleotides that conform to the derived consensus sequence.

An official website of the United States government
Here's how you know
Official websites use .gov
A
.gov website belongs to an official
government organization in the United States.
Secure .gov websites use HTTPS
A lock (
) or https:// means you've safely
connected to the .gov website. Share sensitive
information only on official, secure websites.
