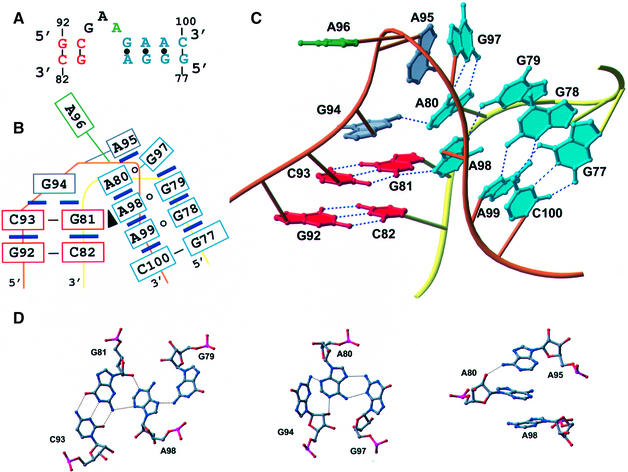
Fig. 2. Structure of KT-7. (A) Secondary structure with residues in the C-stem labeled red and the NC-stem blue. The bulged nucleotide is green. (B) Schematic representation of the relative base-stacking and pairing interactions. A black triangle represents an A-minor interaction. (C) Three-dimensional representation of KT-7 with the phosphate backbone of the kinked strand in orange and the unkinked strand in yellow. Hydrogen bonds are indicated by dashed lines. (D) Atomic details of individual base–base and base–backbone hydrogen bonds.

An official website of the United States government
Here's how you know
Official websites use .gov
A
.gov website belongs to an official
government organization in the United States.
Secure .gov websites use HTTPS
A lock (
) or https:// means you've safely
connected to the .gov website. Share sensitive
information only on official, secure websites.
