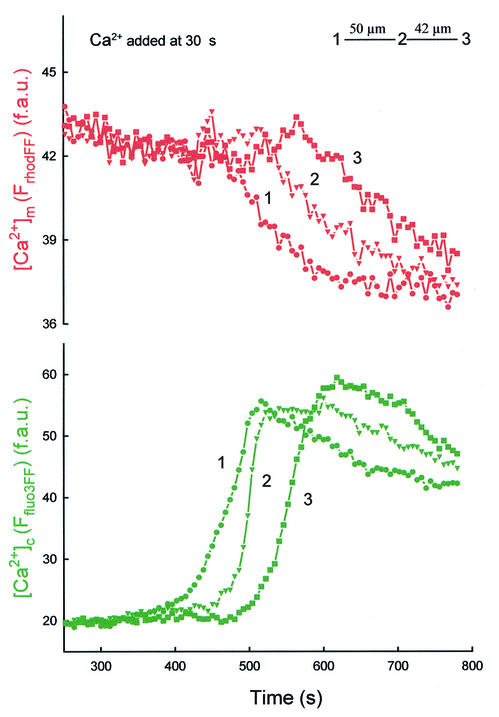
Fig. 3. Decrease in [Ca2+]m during mitochondria-driven [Ca2+]c waves. Measurement of [Ca2+]m was carried out using a low affinity Ca2+ tracer, rhod2FF, simultaneously with measurement of [Ca2+]c using fluo3FF. [Ca2+]c waves were evoked as described in Figure 1. The graph shows traces of [Ca2+]m and [Ca2+]c calculated for three subregions of the cell chosen to be in line with the apparent direction of wave propagation.

An official website of the United States government
Here's how you know
Official websites use .gov
A
.gov website belongs to an official
government organization in the United States.
Secure .gov websites use HTTPS
A lock (
) or https:// means you've safely
connected to the .gov website. Share sensitive
information only on official, secure websites.
