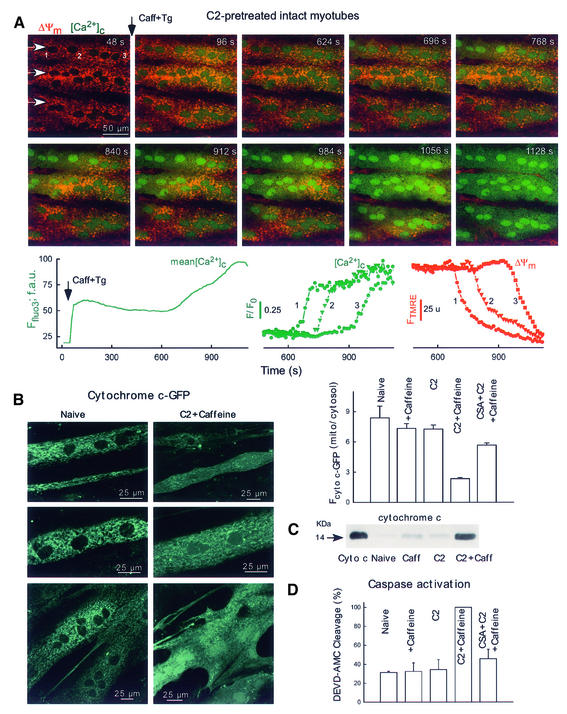
Fig. 7. Mitochondria-driven waves, cyto c release and caspase activation in intact myotubes. (A) Simultaneous confocal imaging of [Ca2+]c and ΔΨm carried out in intact H9c2 myotubes. Fluorescence intensities of TMRE and fluo3 reflecting ΔΨm and [Ca2+]c are depicted on linear red and green scales, respectively. Waves were elicited in C2-pretreated cells (40 µM for 5 h) by addition of caffeine (15 mM) and Tg (2 µM). Arrows in the top left panel show the direction of wave propagation. The graphs show the mean time course profile of [Ca2+]c for the total area of the upper myotube (left) and time courses of [Ca2+]c (middle) and ΔΨm (right) at three intracellular regions selected along the path of wave propagation (50 pixels each, marked with numbers). (B) Cyto c–GFP distribution in intact myotubes. For the experiments shown in (B–D), the adherent myotubes were pre-incubated with C2 (40 µM) or C2 + CSA (1 µM) or solvent for 2 h and, subsequently, 15 mM caffeine or solvent was also added for 4 h. The stimulation protocol is described in detail in Materials and methods. As a quantitative measure of cyto c–GFP release, the mean Fcyto c–GFP was calculated over the mitochondria and over the nucleus (used to assess cytosolic cyto c–GFP) for each cell and the ratios are plotted in the graph (61–191 myotubes). (C) Immunoblots showing cyto c in cytosol samples generated from intact adherent myotubes treated as described in (B). Cyto c, 14 ng cyto c. (D) Caspase activity in cytosol samples generated from intact adherent myotubes (n = 3).

An official website of the United States government
Here's how you know
Official websites use .gov
A
.gov website belongs to an official
government organization in the United States.
Secure .gov websites use HTTPS
A lock (
) or https:// means you've safely
connected to the .gov website. Share sensitive
information only on official, secure websites.
