
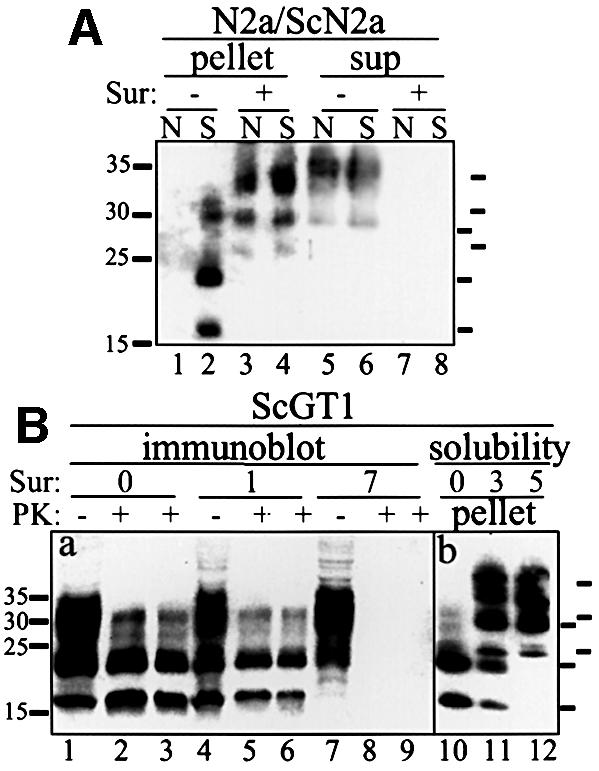
Fig. 1. Induction of insoluble PrP aggregates and reduction of PrPSc by Suramin. (A) Induction of insoluble PrP in N2a and ScN2a cells and reduction of PrPSc determined using a solubility assay. N2a (N; lanes 1, 3, 5 and 7) and ScN2a (S; lanes 2, 4, 6 and 8) cells were treated with Suramin for 7 days (200 µg/ml; lanes 3, 4, 7 and 8) or mock treated (lanes 1, 2, 5 and 6). Cells were lysed and postnuclear lysates were subjected to a solubility assay. PrP was analyzed by immunoblotting using the anti-PrP antibody SAF 70. Detergent-insoluble fractions are shown on the left (pellet; lanes 1–4), soluble fractions on the right (sup; lanes 5–8). Molecular size markers are depicted on the left (kDa); bars on the right indicate the six PrP-specific bands (full-length PrP and N-terminally truncated PrPSc). (B) Reduction of PrPSc and induction of insoluble PrP in ScGT1 cells. Panel (a) shows an immunoblot analysis. ScGT1 cells were treated with Suramin for 1 or 7 days (200 µg/ml; lanes 4–6 and 7–9, respectively) or mock treated (lanes 1–3). Cells were lysed, postnuclear lysates were divided into two parts, and either subjected to digestion with PK (lanes 2, 5 and 8: 20 µg/ml; lanes 3, 6 and 9: 40 µg/ml for 30 min) or proceeded further without PK treatment (lanes 1, 4 and 7). PrP was analyzed by immunoblotting using SAF 70. Panel (b) shows a solubility assay (lanes 10–12). ScGT1 cells were either mock treated (lane 10) or treated for 3 or 5 days with Suramin (200 µg/ml; lanes 11 and 12, respectively). Cells were lysed and postnuclear lysates subjected to a solubility assay. Detergent-insoluble fractions are shown. Bars on the right indicate PrP-specific bands.