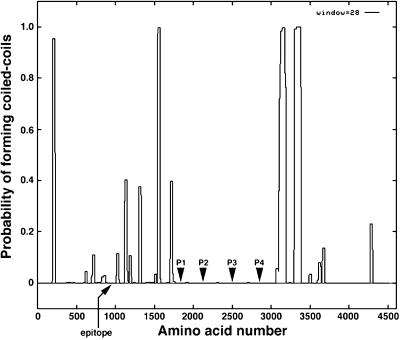
Figure 7.
Diagram depicting regions of high coiled-coil probability for the Dhc10 gene product. The plot was generated using the COILS program (Lupus et al., 1991; Lupus 1996) with a window size of 28 and the MTIDK matrix. The approximate positions of the four central P-loops are indicated by the arrowheads.

