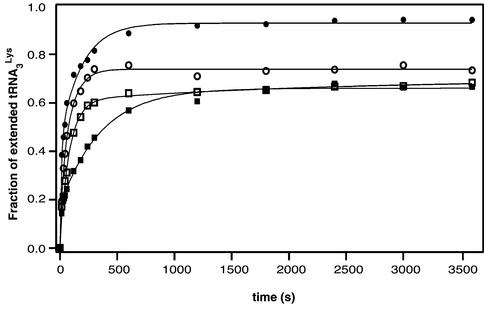
Figure 3.
Kinetics of tRNA3Lys extension. The gels shown in Figure 2 were quantified, and the radioactivity of all extension products divided by the total radioactivity was plotted versus time for the wild type vRNA (closed circles) and mutants 2L (open circles), 2R (closed squares) and 2LR (open squares). The extension rates determined by fitting the experimental data with a single exponential equation are listed in Table 1.

