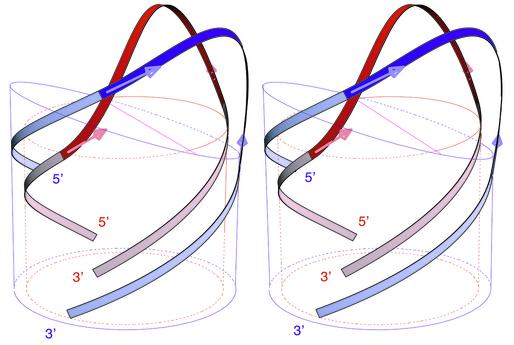
Figure 1.
Superimposed stereo views into the minor groove of the computed elastic rod curve for a DNA tetraloop hairpin, shown in red, and for an RNA tetraloop hairpin shown in blue. The radii of cylinders and circles are those of the sugar–phosphate backbones, DNA (red) and RNA (blue). The mean planes of base pairs are indicated by the top sections of the cylinders.

