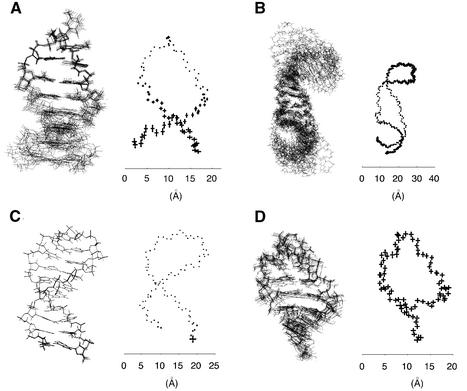
Figure 3.
The first ten superimposed views (left) with the standard deviations of the main atoms of the sugar–phosphate backbone plotted at mean atom positions (right) of the n molecular conformations available in the PDB for the following PDB identifications and sequences: (A) n = 10, 1ac7, DNA tetraloop GTTA, (B) n = 10, 1b36, RNA tetraloop UUCG, (C) n = 10, 1xue, DNA triloop GCA, (D) n = 19, 1c0o, RNA tetraloop UUCG. The molecules are of different sizes, and the scale in Å is provided for comparison.

