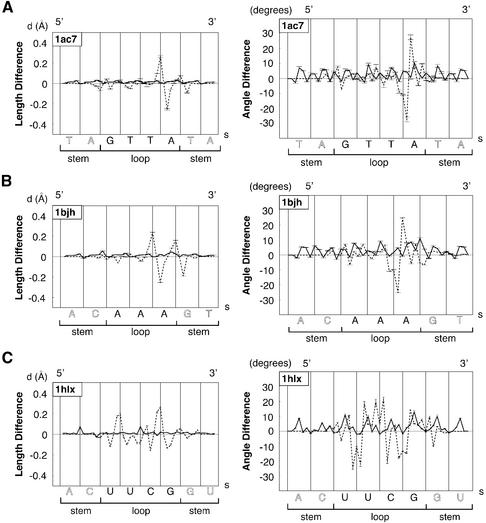
Figure 4.
Typical plots of mean bond length differences in Å (left) and of mean bond angle differences in degrees (right) for the main chain atoms of the sugar–phosphate backbone (O5′, C5′, C4′, C3′, O3′, P) at two building steps along the loop sequence in the 5′→3′ direction as a function of arclength, s, in Å. Plots are representative of the three main classes of molecules, DNA tetraloop, DNA triloops and RNA tetraloops, and are computed with the following loop sequences and PDB identifications: (A) GTTA (1ac7); (B) AAA (1bjh); (C) UUCG (1b36). Dashed lines correspond to the third folding BCE step: differences of bond length or bond angle are between optimised, BCE theoretical structural models, BCE3Ωopt, and reference values from standard helical nucleic acids models (B-DNA or A-RNA before folding). Continuous lines correspond to the last building step: values are computed between energy refined theoretical molecular models, BCE4finalm, and reference values of standard helical nucleic acids. Error bars are calculated from the whole set of molecular conformations in the PDB file.

