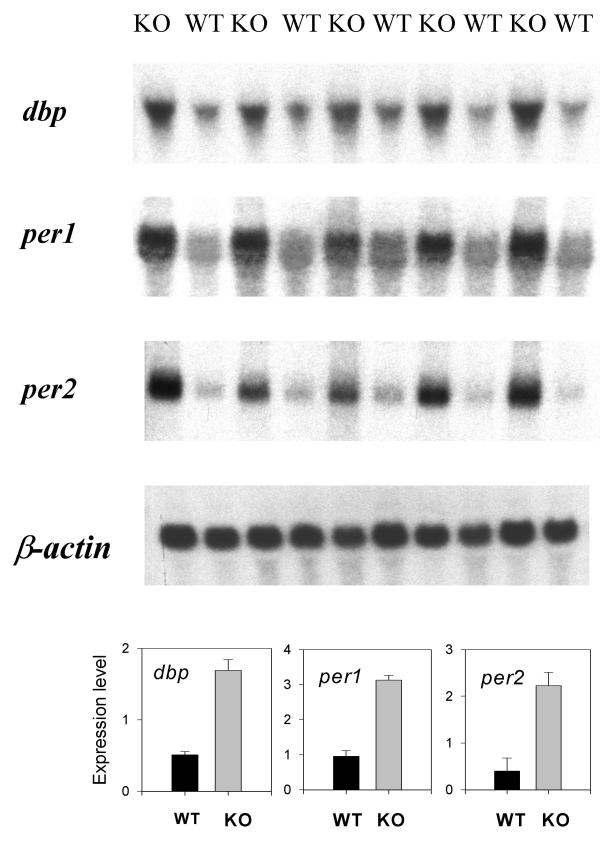
Figure 4.
Whole-brain mRNA levels for dbp, per1, and per2 in cry1,2-/- and wild type mice. Levels of all three genes are elevated in cry1,2-/- mice (KO) relative to wild type (WT) controls at ZT6 when dbp, per1, and per2 mRNAs are lowest in the forebrain of wild type mice [37]. In the lower three panels mean (± 1 SEM) expression levels are depicted. β-actin expression was used as an internal standard.

