

Abstract
BACKGROUND
Patients are often treated in hospital by physicians other than their regular community doctor. After they are discharged, their care is often returned to their regular community doctor and patients may not see the hospital physician. Transfer of information between physicians can be poor. We determined whether early postdischarge outcomes changed when patients were seen after discharge by physicians who treated them in the hospital.
METHODS
This cohort study used population-based administrative databases to follow 938,833 adults from Ontario, Canada, after they were discharged alive from a nonelective medical or surgical hospitalization between April 1, 1995, and March 1, 2000. We determined when patients were seen after discharge by physicians who treated them in the hospital, physicians who treated them 3 months prior to admission (community physicians), and specialists. The outcome of interest was 30-day death or nonelective readmission to hospital.
RESULTS
Of patients studied, 7.7% died or were readmitted. The adjusted relative risk of death or readmission decreased by 5% (95% confidence interval [CI], 4% to 5%) and 3% (95% CI, 2% to 3%) with each additional visit to a hospital physician rather than a community physician or specialist, respectively. The effect of hospital physician visits was cumulative, with the adjusted risk of 30-day death or nonelective readmission reduced to 7.3%, 7.0%, and 6.7% if patients had 1, 2, or 3 visits, respectively, with a hospital rather than a community physician. The effect was consistent across important subgroups.
CONCLUSIONS
Patient outcomes could be improved if their early postdischarge visits were with physicians who treated them in hospital rather than with other physicians. Follow-up visits with a hospital physician, rather than another physician, could be a modifiable factor to improve patient outcomes following discharge from hospital.
Keywords: continuity of care, hospital readmission, population-based, administrative databases
Hospital readmissions are costly 1 and common.2 Studies have identified factors that increase readmission risk, including patient age,3,4 male gender,4 length of stay,5 complications during hospitalization, comorbidities,4–6 medical rather than surgical admissions,4 particular diagnoses,7–9 increased case complexity,10 low patient socioeconomic status,11 day of discharge,12 and prior hospital utilization.3–5,9,13–15 This research identifies patients with a high risk of readmission. However, these factors are primarily immutable.
Modifiable factors associated with poor outcomes after discharge suggest interventions to improve patient care. Coordination of care is one such factor. Care can be coordinated by improving continuity of information or increasing the continuity of care. The former occurs when patients are treated by physicians who know what other physicians who have been treating the patient are doing. Postdischarge outcomes may improve when patient hospital information is disseminated to follow-up physicians.16 However, transfer of patient information between hospitals and community physicians can be poor.17–23 Therefore, hospital-physician continuity of care—which occurs when patients are seen in follow-up by physicians who treated them during the hospitalization—may be particularly important when patients are discharged from hospital.
One randomized trial tested whether outcomes after discharge changed with increased hospital-physician continuity of care.24 Male veterans discharged from hospital were randomized to regular care or intensive follow-up provided by study physicians and nurses who saw the patient prior to discharge. Over a 6-month period, there was no difference between the intervention and control group in the likelihood of nonelective readmissions (80% vs 77%) or preventable readmissions (35% vs 37%). The generalizability and validity of this trial has been questioned because the patients were likely unrepresentative,25,26 and the intervention health staff did not actively treat the patient during the hospitalization.27
The effect of hospital-physician continuity of care upon early outcomes is increasingly important because family physicians are less likely to treat hospitalized patients.28 We therefore used a population-based cohort study to determine whether outcomes changed when physicians who cared for patients during the hospitalization saw them in follow-up.
METHODS
This cohort study took place in Ontario, Canada. During the study period, between 50% and 60% of Ontario family physicians cared for inpatients.29 In 1998, 33.8% of medical inpatients were cared for, at least in part, by their family physician.30
Databases Used for This Study
This study used 3 administrative databases. The Discharge Abstract Database (DAD) records all admissions to Ontario hospitals and documents demographic, diagnostic, procedural, and hospitalization information in a standardized fashion. The Physician Services Database (PSD) records physician claims for visits of more than 95% of family physicians and almost all specialists. The date of each visit, the patient, and the specialty of the physician are recorded for each claim. The Registered Patients Database (RPD) records the death date of all Ontarians, including those who died outside of the province. All databases are anonymous and were linked by common patient unique identifiers. The study was approved by the research ethics board of the Sunnybrook and Women's College Hospital.
Patients
The DAD identified all Ontarians greater than 20 years of age who were admitted and discharged alive from an acute care hospital between April 1, 1995 and March 1, 2000. Only nonelective medical or surgical admissions were included because such patients are substantially different than electively admitted patients. Patients were excluded if they were admitted from or discharged to another hospital, had an invalid patient identifier, lacked key information, or were significant outliers by exceeding the 99th percentile for hospital length of stay, previous hospitalizations, number of follow-up visits, or case resource consumption. Patients were also excluded if they were discharged from one of two hospitals whose physicians do not submit claims to the PSD. Finally, some patients were admitted multiple times during the study. To ensure that all observations in the dataset were truly independent, we randomly selected one admission for each patient.
Predictive Factors
We identified demographic factors associated with hospital readmission. From the DAD, we determined patient age, gender, comorbidities (measured using the Deyo modification of the Charlson score 31), and each person's postal code. The postal code was linked to 1996 Canadian Census information to determine whether patients lived in an urban or rural area and the median household income of each person's area of residence. The latter was used as a proxy measure of socioeconomic status.
Prehospitalization factors included whether patients had a nonelective hospitalization during the 6 months prior to the index admission. This was determined using the DAD. Using the PSD, we also measured the number of physician visits, and the number of different physicians visited, during the 3 months prior to admission.
Hospitalization factors included the hospital length of stay. The discharge diagnostic category was classified by the Case Mix Group (CMG), determined by a Canadian Institute for Health Information (CIHI) algorithm that groups patients with similar diagnoses using diagnostic and procedural codes in the DAD. The CMG was used to classify admissions as medical or surgical. Other hospital information included the weekday of discharge and whether the patient experienced a procedure or complication during the hospitalization. Complications were determined by the presence of any type-2 International Classification of Diseases, Ninth Revision (ICD-9) diagnoses. Finally, case resource consumption was measured using the Resource Intensity Weight (RIW), another CIHI methodology measuring hospitalization costliness with the DAD.
Follow-up factors were all measured with the PSD. We determined the date of all physician visits in the month after discharge from hospital. To measure the effect of community continuity of care, we determined which postdischarge visits were with physicians who saw the patient in the 3 months prior to hospitalization (herewith called a “community physician”). To measure the effect of specialty, we determined which postdischarge visits were with a “specialist” (physician whose specialty code in the PSD was not “general practitioner” or “family physician”). In Canada, internists function as consultants and generally do little primary care. To measure the effect of hospital continuity of care, we determined which postdischarge visits were with physicians who treated the patients during the hospitalization (referred to as a “hospital physician”). The DAD records hospitalization admit and discharge dates. Physicians with assessment claims between admit and discharge dates were a hospital physician for that patient. Community physician, specialist, and hospital physician visits are not mutually exclusive. For example, a particular visit would be with both a community physician and a hospital physician if the physician saw that patient prior to and during the hospitalization. The multivariate analysis in the study was able to distinguish the independent effect of each follow-up physician type.
Outcome
The study outcome was death or nonelective readmissions to hospital in the first 30 days. This combined outcome avoids the bias of censoring deaths when hospital readmission alone is examined.32 In addition, the relationship between readmission and survival varies between diagnoses.7 Readmissions were identified in the DAD. Deaths were identified in the RPD.
Analyses
To determine the effect of follow-up visits upon outcomes, we determined the cumulative number of each visit type for each patient during the first 30 days after discharge. These are time-dependent variables because their values change over time. We therefore used proportional hazards techniques with time-dependent covariates to model their effect upon patient outcome after controlling for significant confounders.33 Time-dependent covariate analysis avoids survivor treatment selection bias.34
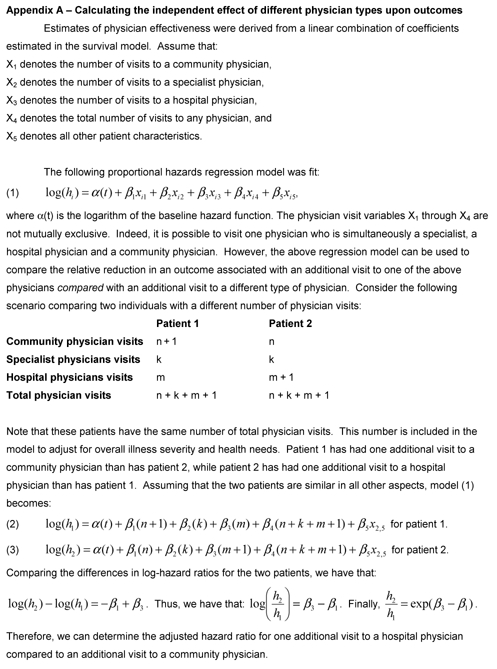
To build our models, we identified demographic, prehospitalization, and hospitalization factors that were significantly (two-sided P value of .05) associated with 30-day death or nonelective readmission in a univariate proportional hazards model. These variables were offered to a backward-stepping proportional hazards model that determined which were independently associated with the outcome. These independent variables were included in the final model with follow-up visits types (i.e., cumulative number of all physician visits, community physician visits, specialist visits, and hospital physician visits) expressed as time-dependent covariates. The hazard ratios for contrasting follow-up visit types were calculated from this model (see Appendix A, available at http://www.jgim.org). For example, the hazard ratio for visiting a hospital physician rather than a community physician was e(β[hospital physician visit]−β[community physician visit]).Each model was stratified by hospital, which allows the underlying hazard function to vary between hospitals and adjusts for unmeasured hospital factors.35 We reasoned that patients with more physician visits are sicker and are more likely to die or be readmitted to hospital and controlled for this by including the cumulative number of all physician visits in all models.
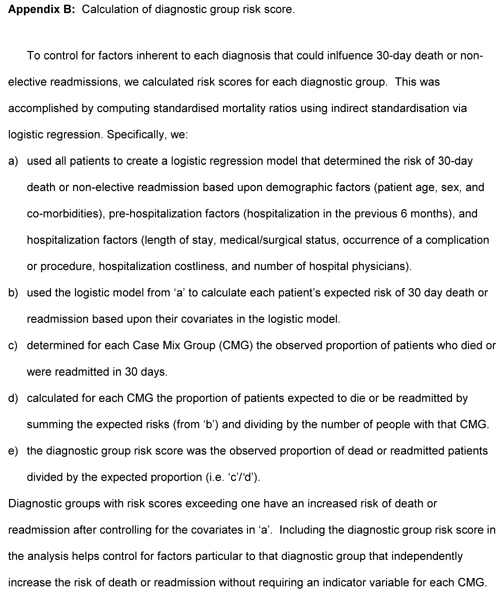
Readmission risk varies widely between diagnoses.8 To control for the effect of diagnosis upon outcome, we used established methodology 36 to calculate risk scores for each diagnostic group (Appendix B), available at http://www.jgim.org).37
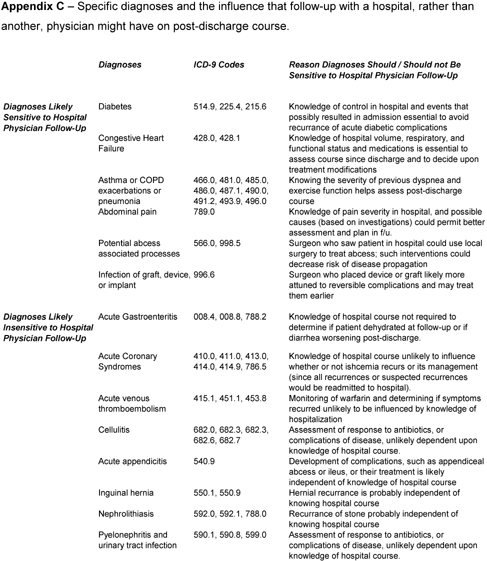
We conducted several subanalyses to measure the consistency of our findings. Analysis was limited to subgroups of the most predictive baseline factors including propensity score quintiles. We repeated the analysis for patients whose number of physician visits after discharge did not exceed the 75th percentile (3 visits) to determine whether outlier patients with many follow-up visits influenced the association. We a priori identified common diagnoses whose postdischarge course either could be, or should not be, influenced by hospital physician follow-up (Appendix C), available at http://www.jgim.org). We hypothesized that hospital physician follow-up should be more beneficial in the former diagnoses. Finally, similar to previous studies,38 we conducted the analysis separately for the 100 most common discharge diagnoses and used the Sign test 39 to determine whether the number of diagnoses in which hospital physician follow-up was protective exceeded that expected by chance.
RESULTS
During the study period, 2,607,416 adults had a nonelective hospitalization. Some 1,668,583 hospitalizations were excluded because the patient died during the hospitalization (n= 89,756), the patient was transferred to or from another hospital (n= 97,885), the patient had an invalid Ontario Health Insurance Plan (OHIP) number (n= 5), the patient was discharged from an excluded hospital (n= 19,287), the patient was an outlier (n= 14,614), the patient was missing data (n= 19,246), or the hospitalization was randomly excluded because the patient had other hospitalizations during the study period (n= 1,427,790).
This left 938,833 patients in the study (Table 1) Most patients had Charlson-Deyo scores of zero. The most common medical diagnostic groups included acute gastroenteritis or gastrointestinal bleeding (8.6% of medical diagnoses), pneumonia (5.1%), and chest pain (5.1%). For surgery, the most common groups included acute fractures (8.8%), appendectomy (7.3%), and laparoscopic cholecystectomy (6.1%). Patients were spread equally through the 5 study years and came from 185 different hospitals. During the entire study, 43.5% of patients were treated in hospital by a physician who had seen them during the 3 months prior to admission. This proportion decreased steadily through the study from 45.6% in 1995 to 41.0% in 1999.
Table 1.
Cohort Description of Baseline, Hospital, and Follow-up Factors and Their Association with 30-Day Risk of Death or Urgent Readmission
| Dead or Readmitted in 30 Days | ||||
|---|---|---|---|---|
| All Patients (N= 938,833) | Yes N= 71,944 (7.7%) | No N= 866,889 (92.3%) | Unadjusted Hazard Ratio (95% CI) | |
| Baseline Factors | ||||
| Mean age, y (SD) | 57.3 (18.9) | 65.6 (17.2) | 56.7 (18.9) | 1.31 (1.30 to 1.31)* |
| Male | 466,610 (49.7) | 37,247 (51.8) | 429,363 (49.5) | 1.07 (1.06 to 1.09) |
| Charlson score = 0, n(%) | 694,542 (74.0) | 37,632 (52.3) | 656,910 (75.8) | 1.39 (1.38 to 1.39) |
| Hospitalized in last 6 months, n(%) | 114,432 (12.2) | 21,292 (29.6) | 93,140 (10.7) | 3.27 (3.22 to 3.32) |
| Median MD visits, last 3 months, n | 3 (1–6) | 5 (2–11) | 3 (1–5) | 1.05 (1.05 to 1.05) |
| Median MD visits, last 3 months, n | 2 (1–3) | 2 (1–4) | 2 (1–3) | 1.19 (1.19 to 1.19) |
| Urban locale, n(%) | 793,211 (84.5) | 61,052 (84.9) | 732,159 (84.5) | 1.08 (1.06 to 1.10) |
| Median household incomes, n(%) | ||||
| < 38,321 | 206,066 (22.0) | 16,852 (23.4) | 189,214 (21.8) | 0.97 (0.96 to 0.98) |
| 38,321 to 41,252 | 222,407 (23.7) | 17,797 (24.7) | 204,610 (23.6) | |
| 41,252 to 52,620 | 290,164 (30.9) | 21,930 (30.5) | 268,234 (30.9) | |
| >62,262 | 220,196 (23.0) | 15,365 (21.4) | 204,831 (23.6) | |
| Diagnostic risk scores, n(%) | ||||
| < 0.66 | 218,255 (23.3) | 7,583 (10.5) | 208,777 (24.3) | 1.71 (1.70 to 1.72) |
| 0.66–0.92 | 328,898 (34.4) | 19,793 (27.5) | 303,105 (35.0) | |
| 0.92–1.26 | 264,184 (28.1) | 21,974 (30.5) | 242,210 (27.9) | |
| >1.26 | 133,496 (14.2) | 22,594 (31.4) | 110,902 (12.8) | |
| Hospitalization Factors | ||||
| Mean length of stay, days (SD) | 5.1 (5.5) | 7.4 (6.8) | 5.1 (5.3) | 1.05 (1.05 to 1.05) |
| Complication, n(%) | 64,193 (6.8) | 6,999 (9.7) | 57,194 (6.6) | 1.49 (1.45 to 1.53) |
| Procedure, n(%) | 469,560 (50.0) | 33,487 (46.6) | 436,073 (50.3) | 0.85 (0.84 to 0.86) |
| Medical admission, n(%) | 719,354 (76.6) | 61,203 (85.1) | 658,151 (75.9) | 1.84 (1.80 to 1.88) |
| Mean RIW (SD) | 1.2 (1.0) | 1.5 (1.2) | 1.2 (1.0) | 1.25 (1.24 to 1.25) |
| Median hospital MD visits, n(IQR) | 2 (1–3) | 2 (2–4) | 2 (1–3) | 1.16 (1.15 to 1.16) |
| Friday discharge, n(%) | 181,117 (19.4) | 14,511 (21.4) | 166,606 (19.2) | 1.10 (1.07 to 1.13) |
| Follow-up Factors, median (IQR) | ||||
| All MD visits | 2 (1–3) | 1 (0–2) | 2 (1–3) | 1.22 (1.21 to 1.22) |
| Community MD | 1 (0–2) | 0 (0–1) | 1 (0–2) | 1.23 (1.22 to 1.24) |
| Specialist | 0 (0–1) | 0 (0–1) | 0 (0–1) | 1.17 (1.16 to 1.18) |
| Hospital MD | 1 (0–1) | 0 (0–1) | 1 (0–2) | 1.17 (1.16 to 1.18) |
The hazard ratio indicates the unadjusted association of each factor with time to death or readmission and is stratified by hospital. Patients with Charlson scores of zero are free of significant comorbidities.
Hazard ratio indicates changes in death or readmission with increased decade of age.
SD, standard deviation; RIW, resource intensity weighting; IQR, interquartile range; CI, confidence interval.
Overall, 71,944 (7.7%) patients had an event (Table 1). Deaths accounted for 14.6% of events. The risk of death or readmission was highest if patients were older, had been hospitalized in the last 6 months, had a diagnostic group with a high-risk score, or had a medical admission (Table 1). The relative risk of death or readmission decreased 3% with each year beyond 1995 (independent hazard ratio, 0.97; 95% confidence interval [CI], 0.96 to 0.98). The univariate analysis showed that the risk of death or readmission increased with each additional visit with all physicians, with community physicians, with specialists, or with hospital physicians (Table 1).
Patients had a median of 2 physician visits in the first month after discharge (Table 1). Approximately half of these were with hospital physicians. Of the patients, 751,775 (80.1%) had one or more physician visits, 473,814 (50.5%) saw one or more community physicians, 448,035 (47.7%) saw one or more specialists, and 662,029 (70.5%) saw one or more hospital physicians. Patients who saw hospital physicians appeared sicker because they were older, had higher Charlson and diagnostic risk scores, and were more likely to have a medical admission (Table 2) This was true even when patients with no follow-up visits were excluded (Table 2).
Table 2.
Patient Factors Associated with Seeing at Least One Hospital Physician in the First Month After Discharge from Hospital
| Follow-up Visit with a Hospital Physician | |||
|---|---|---|---|
| All patients (N= 938,833) | Yes (N= 474,971, 50.6%) | No (N= 463,862, 49.4%) | P Value |
| Mean age, y (SD) | 58.7 (18.3) | 56.0 (19.4) | <.0001 |
| Charlson score = 0, n(%) | 344,504 (72.5) | 350,038 (75.5) | <.0001 |
| Hospitalized in last 6 months, n(%) | 56,414 (11.9) | 58,018 (12.5) | <.0001 |
| Diagnostic risk scores, n(%) | |||
| <0.66 | 103,183 (21.7) | 115,072 (24.8) | <.0001 |
| 0.66 to 0.92 | 164,124 (34.5) | 158,774 (34.2) | |
| 0.92 to 1.26 | 136,728 (28.8) | 127,456 (27.5) | |
| >1.26 | 70,936 (14.9) | 62,560 (13.5) | |
| Medical admission | 370,814 (78.1) | 348,540 (75.1) | <.0001 |
| Patients with ≥1 follow-up (N= 751,775) | Yes (N= 474,971, 63.2%) | No (N= 276,804, 36.8%) | |
|---|---|---|---|
| Mean age, y (SD) | 58.7 (18.3) | 57.1 (18.8) | <.0001 |
| Charlson Score = 0, n(%) | 344,504 (72.5) | 205,170 (74.1) | <.0001 |
| Hospitalized in last 6 months, n(%) | 56,414 (11.9) | 35,983 (13.0) | <.0001 |
| Diagnostic risk scores, n(%) | |||
| <0.66 | 103,183 (21.7) | 70,784 (25.6) | <.0001 |
| 0.66 to 0.92 | 164,124 (34.5) | 93,037 (33.6) | |
| 0.92 to 1.26 | 136,728 (28.8) | 74,751 (27.0) | |
| >1.26 | 70,936 (14.9) | 38,232 (13.8) | |
| Medical admission, n(%) | 370,814 (78.1) | 206,804 (74.7) | <.0001 |
The top portion of the table compares all patients based upon who did and who did not see a hospital physician after discharge from hospital. The lower portion limits the comparison to patients who had at least one physician visit. Patients with Charlson scores of zero are free of significant comorbidities.
SD, standard deviation.
After controlling for important confounders, patients were significantly less likely to die or be readmitted if they were seen in follow-up by a hospital physician rather than a community physician (hazard ratio, 0.95; 95% CI, 0.95 to 0.96) or specialist (hazard ratio, 0.97; 95% CI, 0.97 to 0.98;Table 3) This means that the relative risk of death or readmission decreased by 5% (95% CI, 2% to 4%) when patients followed up with a hospital rather than a community physician. Given a baseline risk of 7.7%, the adjusted risk of 30-day death or nonelective readmission would be 7.3%, 7.0%, and 6.6% for patients who had 1, 2, or 3 visits, respectively, with a hospital rather than a community physician.
Table 3.
Independent Effect of Patient, Hospitalization, and Follow-up Factors on 30-Day Death or Nonelective Readmission
| Adjusted Hazard Ratio (95% CI) | |
|---|---|
| Patient Factors | |
| Age increased by decade | 1.16 (1.16 to 1.17) |
| Patient is male | 1.07 (1.06 to 1.09) |
| Charlson score increased by 1 | 1.21 (1.21 to 1.22) |
| Study year increased by 1 | 0.97 (0.96 to 0.98) |
| Hospitalization in last 6 months | 1.73 (1.69 to 1.76) |
| Pre-admission MD visits increased by 1 | 1.01 (1.01 to 1.01) |
| Pre-admission MDs increased by 1 | 1.04 (1.03 to 1.04) |
| Diagnosis risk score increased to next quartile | 1.45 (1.44 to 1.46) |
| Hospital Factors | |
| Length of stay increased 1 day | 1.01 (1.01 to 1.01) |
| Complication during admission | 1.11 (1.08 to 1.14) |
| Procedure during admission | 0.96 (0.94 to 0.98) |
| Medical admission | 1.75 (1.70 to 1.80) |
| Resource Intensity Weighting increased 1 unit | 1.07 (1.06 to 1.08) |
| Number of hospital MDs increased by 1 | 1.01 (1.00 to 1.01) |
| Friday discharge | 1.06 (1.03 to 1.08) |
| Follow-up Factors | |
| One more visit with hospital MD vs community MD | 0.95 (0.95 to 0.96) |
| One more visit with hospital MD vs specialist | 0.97 (0.97 to 0.98) |
The hazard ratio indicates the association of each factor with time to death or readmission after adjusting for all other factors in the table. The hazard ratio is stratified by hospital. Resource Intensity Weighting is a measure of hospitalization costliness. A hospital physician is one who saw the patient during their hospitalization. A community physician is one who saw the patient in the 3 months prior to their admission. A specialist is a physician whose specialty was anything other than general or family practitioner. This model controls for the total number of all physician visits.
CI, confidence interval.
The protective effect of hospital physician follow-up was consistent within important subgroups with some possible exceptions (Table 4) Compared to community physicians, hospital physician follow-up was significantly protective for all subgroups except patients with previous hospitalizations. Compared to specialists, hospital physician follow-up was significantly protective for all subgroups except those with previous hospitalizations, elderly patients, and those with high-risk diagnoses. The benefit of hospital physician follow-up appeared to decrease as the diagnostic risk score increased. Protection with hospital physician follow-up remained when the analysis was limited to patients whose total number of postdischarge visits did not exceed the 75th percentile. Hospital physician follow-up was more effective for diagnoses thought likely be sensitive to hospital physician follow-up (Table 4);Appendix C, online). Follow-up with a hospital physician versus a community physician was equally beneficial when analysis was limited to patients who were not seen in hospital by community physicians (hazard ratio, 0.95; 95% CI, 0.95 to 0.96). Finally, follow-up with a hospital physician appeared protective (i.e., had a hazard ratio of less than 1.0) for 70 out of the 100 most common diagnoses, which significantly exceeds that expected by chance (P < .0001).
Table 4.
Subgroup Analysis of the Effect of Hospital Physician Follow-up on 30-Day Death or Nonelective Readmission
| Independent Hazard Ratio of Additional Visit with a Hospital Physician (95% CI) | |||
|---|---|---|---|
| Versus Community MD | Versus Specialist MD | ||
| Patient age, y | ≤45 | 0.98 (0.98 to 0.99) | 0.91 (0.89 to 0.93) |
| 46 to 60 | 0.97 (0.95 to 0.98) | 0.96 (0.94 to 0.97) | |
| 61 to 75 | 0.98 (0.97 to 0.99) | 0.98 (0.97 to 0.99) | |
| >75 | 0.93 (0.92 to 0.94) | 1.00 (0.98 to 1.00) | |
| Charlson score | 0 | 0.96 (0.95 to 0.97) | 0.94 (0.93 to 0.95) |
| >0 | 0.95 (0.95 to 0.97) | 0.99 (0.98 to 1.00) | |
| Previous hospitalization | No | 0.94 (0.93 to 0.95) | 0.96 (0.96 to 0.97) |
| Yes | 1.02 (1.01 to 1.03) | 1.02 (1.01 to 1.03) | |
| Diagnostic risk score | <0.66 | 0.94 (0.92 to 0.95) | 0.91 (0.90 to 0.93) |
| 0.66 to 0.92 | 0.95 (0.94 to 0.96) | 0.96 (0.95 to 0.98) | |
| 0.92 to 1.26 | 0.96 (0.95 to 0.97) | 0.97 (0.96 to 0.99) | |
| >1.26 | 0.97 (0.96 to 0.98) | 1.01 (1.00 to 1.02) | |
| Admission type | Medical | 0.96 (0.95 to 0.96) | 0.97 (0.96 to 0.98) |
| Surgical | 0.93 (0.91 to 0.94) | 0.92 (0.90 to 0.93) | |
| Diagnostic type | Hospitalist F/U Sensitive | 0.96 (0.94 to 0.98) | 0.99 (0.97 to 1.00) |
| Hospitalist F/U Insensitive | 0.99 (0.98 to 1.01) | 0.91 (0.90 to 0.93) | |
| Hospital status | Teaching | 0.97 (0.96 to 0.98) | 0.98 (0.97 to 0.99) |
| Nonteaching | 0.95 (0.94 to 0.95) | 0.97 (0.96 to 0.97) | |
| Patient residence | Urban | 0.95 (0.95 to 0.96) | 0.97 (0.97 to 0.98) |
| Rural | 0.95 (0.93 to 0.97) | 0.96 (0.95 to 0.98) | |
| Year | 1995 | 0.97 (0.95 to 0.98) | 0.99 (0.98 to 1.00) |
| 1996 | 0.96 (0.95 to 0.98) | 0.98 (0.96 to 0.99) | |
| 1997 | 0.93 (0.92 to 0.94) | 0.98 (0.97 to 0.99) | |
| 1998 | 0.95 (0.94 to 0.96) | 0.96 (0.95 to 0.97) | |
| 1999 | 0.96 (0.95 to 0.98) | 0.96 (0.94 to 0.97) | |
| Hospital area | North | 0.95 (0.93 to 0.97) | 0.96 (0.95 to 0.98) |
| Eastern | 0.98 (0.96 to 0.99) | 0.98 (0.97 to 1.00) | |
| Central East | 0.96 (0.95 to 0.98) | 0.98 (0.96 to 0.99) | |
| Toronto | 0.96 (0.95 to 0.97) | 0.94 (0.93 to 0.96) | |
| Central West | 0.96 (0.95 to 0.98) | 0.97 (0.95 to 0.98) | |
| Central South | 0.95 (0.93 to 0.97) | 1.01 (0.99 to 1.03) | |
| South West | 0.93 (0.92 to 0.95) | 0.99 (0.98 to 1.01) | |
The proportional hazards analysis was limited to each subgroup listed in the table. The hazards ratio is adjusted for all factors listed in Table 3.
F/U, follow-up.
DISCUSSION
Using population-based administrative databases over a 5-year period, we found that patients having hospital physician follow-up were significantly and independently less likely to die or get urgently readmitted to hospital in the first 30 days following discharge. After controlling for other important factors, the risk of death or readmission decreased when patients were seen by a hospital physician rather than by another physician. This association was consistent across important subgroups.
Although the effect of hospital physician follow-up was smaller than other factors, our findings are still important. Nonelective readmission and death are both clearly important outcomes and any decrease in their frequency is desirable. These events affect many people, thereby making even small decreases in their frequency significant. The effect of hospital physician follow-up is cumulative so that the risk of death or readmission decreases with each visit. Most importantly, hospital physician follow-up is a potentially modifiable factor that could decrease the risk of bad outcomes post discharge.
In contrast to continuity of care in the community,40–43 the effect of continuity of care with hospital physicians has not been studied extensively. Several issues explain why our results differ from those of Weinberger et al.24 We only examined the first 30 days after discharge from hospital. Our study included all Ontario hospitals and a diverse patient population. Also, all of the hospital physicians in our study treated the patients during, and commonly throughout, their hospitalization. Because our study was population based, included readmissions to all hospitals, and adjusted for important confounders, we believe that it is a very representative assessment of the effect that continuity of care after discharge from hospital has upon patient outcomes.
Hospital physician follow-up could improve outcomes through several mechanisms. Hospital information is often inadequately transferred to community physicians 17 and is key to evaluating a patient in the early postdischarge time period. Familiarity with the hospital course allows follow-up physicians to determine therapeutic effectiveness and identify complications of hospital therapies or procedures. Complications that are dealt with early could avoid more serious subsequent problems. Finally, patients are often discharged from hospital with problems that are improving but not yet resolved. Therefore, patients seen early following discharge from hospital can still be very ill. If a physician does not know that a particular patient was worse when they were admitted to hospital, their condition could be interpreted as a deterioration requiring readmission.
This last point highlights a limitation of our study. Although we measured urgent readmissions to all Ontario hospitals, we were unable to determine the appropriateness of these readmissions. As with any health service, physician practice patterns can influence the decision to admit a patient, possibly independent of a patient's clinical status. Other factors extraneous to the patient's health can also modify the decision to admit a patient to hospital. Despite the “noise” that these factors introduce to this outcome, we still found an independent and significant association between hospital physician follow-up and improved outcomes.
Several aspects of our data support a cause-and-effect relationship between hospital physician follow-up and improved outcomes.44 There are many reasons to expect better outcomes with hospital physician follow-up. We found a dose-response effect with further improvement of outcomes with each additional hospital physician visit. Our association was consistent in several distinct populations. Finally, there is no ambiguity in the timing of the hospital physician visit in relation to the death or readmission.
However, our study does not absolutely establish better outcomes with hospital physician follow-up. Relative to other factors, the independent association of hospital physician follow-up is small. Hospital physician follow-up was not enormously more successful in diagnoses that we thought would be more sensitive to such visits, although this classification is admittedly rather crude and very susceptible to exceptions. This could be from our inability to control for factors that might contribute to outcomes, such as hospital quality of care.45–48 Our study also did not measure or control for dissemination of patient-specific information after discharge from hospital, which may influence patient outcomes.16 Finally, although the analysis adjusted for many important factors that could influence patient outcome and the results were very consistent in many pertinent subgroups, there still remains a possibility that patients who are seen in follow-up by hospital physicians are systematically distinct from those who are followed by community physicians in important factors that are not measured in the databases used in this study. A better understanding of the effect that hospital physician follow-up has upon patient outcomes requires further research.
What should physicians, patients, and administrators do until such evidence is available? We believe that patients who require physician assessment after being discharged from hospital should be seen by physicians who actually cared for them during the hospitalization. At the very least, physicians who see the patient should have access to as much information regarding the hospitalization as possible.
Acknowledgments
We thank Drs. Alan Forster, David Juurlink, Alan Karovitch, Stephen Kravcik, Andreas Laupacis, Graham Nichol, Jim Nishikawa, Donald Redelmeier, Tom Stelfox, and James Watters for comments on initial drafts of this paper.
Dr. van Walraven is an Ontario Ministry of Health Career Scientist.
Dr. van Walraven conceived the study and is the responsible author. All authors contributed to the study's design, analysis, interpretation, and writing.
Appendix A
Calculating the independent effect of different types upon outcomes
Appendix B
Calculation of diagnostic group risk score
Appendix C
Specific diagnoses and the influence that follow-up with a hospital, rather than another, physician might have on post-discharge course
REFERENCES
- 1.Anderson GF, Steinberg EP. Hospital readmissions in the Medicare population. N Engl J Med. 1984;311:1349–53. doi: 10.1056/NEJM198411223112105. [DOI] [PubMed] [Google Scholar]
- 2.Soeken KL, Prescott PA, Herron DG, Creasia J. Predictors of hospital readmission. A meta-analysis. Eval Health Prof. 1991;14:262–81. doi: 10.1177/016327879101400302. [DOI] [PubMed] [Google Scholar]
- 3.Boult C, Dowd B, McCaffrey D, Boult L, Hernandez R, Krulewitch H. Screening elders for risk of hospital admission. J Am Geriatr Soc. 1993;41:811–7. doi: 10.1111/j.1532-5415.1993.tb06175.x. [DOI] [PubMed] [Google Scholar]
- 4.Anderson GF, Steinberg EP. Predicting hospital readmissions in the Medicare population. Inquiry. 1985;22:251–8. [PubMed] [Google Scholar]
- 5.Krumholz HM, Parent EM, Tu N, et al. Readmission after hospitalization for congestive heart failure among Medicare beneficiaries. Arch Intern Med. 1997;157:99–104. [PubMed] [Google Scholar]
- 6.Chin MH, Goldman L. Correlates of early hospital readmission or death in patients with congestive heart failure. Am J Cardiol. 1997;79:1640–4. doi: 10.1016/s0002-9149(97)00214-2. [DOI] [PubMed] [Google Scholar]
- 7.Hennen J, Krumholz HM, Radford MJ, Meehan TP. Readmission rates, 30 days and 365 days postdischarge, among the 20 most frequent DRG groups, Medicare inpatients age 65 or older in Connecticut hospitals, fiscal years 1991, 1992, and 1993. Conn Med. 1995;59:263–70. [PubMed] [Google Scholar]
- 8.Holloway JJ, Medendorp SV, Bromberg J. Risk factors for early readmission among veterans. Health Serv Res. 1990;25(1 pt 2):213–37. [PMC free article] [PubMed] [Google Scholar]
- 9.Phillips RS, Safran C, Cleary PD, Delbanco TL. Predicting emergency readmissions for patients discharged from the medical service of a teaching hospital. J Gen Intern Med. 1987;2:400–5. doi: 10.1007/BF02596366. [DOI] [PubMed] [Google Scholar]
- 10.Stanton BA, Jenkins CD, Goldstein RL, et al. Hospital readmissions among survivors six months after myocardial revascularization. JAMA. 1985;253:3568–73. [PubMed] [Google Scholar]
- 11.Weissman JS, Stern RS, Epstein AM. The impact of patient socioeconomic status and other social factors on readmission: a prospective study in four Massachusetts hospitals. Inquiry. 1994;31:163–72. [PubMed] [Google Scholar]
- 12.van Walraven C, Bell CM. Risk of death or readmission among people discharged from hospital on Fridays. CMAJ. 2002;166:1672–3. [PMC free article] [PubMed] [Google Scholar]
- 13.Reed RL, Pearlman RA, Buchner DM. Risk factors for early unplanned hospital readmission in the elderly. J Gen Intern Med. 1991;6:223–8. doi: 10.1007/BF02598964. [DOI] [PubMed] [Google Scholar]
- 14.Corrigan JM, Martin JB. Identification of factors associated with hospital readmission and development of a predictive model. Health Serv Res. 1992;27:81–101. [PMC free article] [PubMed] [Google Scholar]
- 15.Colledge NR, Ford MJ. The early hospital readmission of elderly people. Scott Med J. 1994;39:51–2. doi: 10.1177/003693309403900206. [DOI] [PubMed] [Google Scholar]
- 16.van Walraven C, Seth R, Austin PC, Laupacis A. The effect of discharge summary availability during post-discharge outpatient visits on readmission to hospital. J Gen Intern Med. 2002;17:1–8. doi: 10.1046/j.1525-1497.2002.10741.x. [DOI] [PMC free article] [PubMed] [Google Scholar]
- 17.Bolton P, Mira M, Kennedy P, Lahra MM. The quality of communication between hospitals and general practitioners: an assessment. J Qual Clin Pract. 1998;18:241–7. doi: 10.1046/j.1440-1762.1998.00281.x. [DOI] [PubMed] [Google Scholar]
- 18.Fair JF. Hospital discharge and death communications. Br J Hosp Med. 1989;42:59–61. [PubMed] [Google Scholar]
- 19.Lockwood E, McCallum FM. Patients discharged from hospital: an aspect of communication in the Health Service. Health Bull. 1970;28:75–80. [PubMed] [Google Scholar]
- 20.van Walraven C, Weinberg AL. Quality assessment of a discharge summary system. Can Med Assoc J. 1995;152:1437–42. [PMC free article] [PubMed] [Google Scholar]
- 21.Mageean RJ. Study of “discharge communications” from hospital. Br Med J (Clin Res Ed). 1986;293:1283–4. doi: 10.1136/bmj.293.6557.1283. [DOI] [PMC free article] [PubMed] [Google Scholar]
- 22.Harding J. Study of discharge communications from hospital doctors to an inner London general practice. J R Coll Gen Pract. 1987;37:494–5. [PMC free article] [PubMed] [Google Scholar]
- 23.Penney TM. Delayed communication between hospitals and general practitioners: where does the problem lie? Br Med J. 1988;297:28–9. doi: 10.1136/bmj.297.6640.28-a. [DOI] [PMC free article] [PubMed] [Google Scholar]
- 24.Weinberger M, Oddone EZ, Henderson WG. Does increased access to primary care reduce hospital readmissions? Veterans Affairs Cooperative Study Group on Primary Care and Hospital Readmission. N Engl J Med. 1996;334:1441–7. doi: 10.1056/NEJM199605303342206. [DOI] [PubMed] [Google Scholar]
- 25.Magill MK, Babitz M, Silver MP. A trial of increased access to primary care. N Engl J Med. 1996;335:896–8. [PubMed] [Google Scholar]
- 26.Starfield B, Parrino TA. A trial of increased access to primary care. N Engl J Med. 1996;335:895–6. [PubMed] [Google Scholar]
- 27.Henley DE. A trial of increased access to primary care. N Engl J Med. 1996;335:895–8. doi: 10.1056/NEJM199609193351214. [DOI] [PubMed] [Google Scholar]
- 28.Paterson JM, Allega RL, Shea PE. Role of family physicians in hospitals: did it change between 1977 and 1997? Can Fam Physician. 2001;47:971–80. [PMC free article] [PubMed] [Google Scholar]
- 29.Chan BT. The declining comprehensiveness of primary care. CMAJ. 2002;166:429–34. [PMC free article] [PubMed] [Google Scholar]
- 30.Jaakimainen L, Pimlott N, Holzapfel S. A descriptive analysis of the provision of inpatient care by Ontario family physicians. North American Primary Care Research Group: 2001. Abstract. [Google Scholar]
- 31.Deyo RA, Cherkin DC, Ciol MA. Adapting a clinical comorbidity index for use with ICD-9-CM administrative databases. J Clin Epidemiol. 1992;45:613–9. doi: 10.1016/0895-4356(92)90133-8. [DOI] [PubMed] [Google Scholar]
- 32.Ashton CM, Wray NP. A conceptual framework for the study of early readmission as an indicator of quality of care. Soc Sci Med. 1996;43:1533–41. doi: 10.1016/s0277-9536(96)00049-4. [DOI] [PubMed] [Google Scholar]
- 33.Allison PD. Survival Analysis Using the SAS System. Cary, NC: SAS Institute Inc.; 2000. Estimating Cox-regression Models with PROC PHREG; pp. 111–84. [Google Scholar]
- 34.Glesby MJ, Hoover DR. Survivor treatment selection bias in observational studies: examples from the AIDS literature. Ann Intern Med. 1996;124:999–1005. doi: 10.7326/0003-4819-124-11-199606010-00008. [DOI] [PubMed] [Google Scholar]
- 35.Harrell FE. Regression Modeling Strategies. New York, NY: Springer; 2001. Cox proportional hazards regression model; pp. 465–507. [Google Scholar]
- 36.Tu JV, Austin PC, Chan BT. Relationship between annual volume of patients treated by admitting physician and mortality after acute myocardial infarction. JAMA. 2001;285:3116–22. doi: 10.1001/jama.285.24.3116. [DOI] [PubMed] [Google Scholar]
- 37.Tu JV, Naylor CD, Austin P. Temporal changes in the outcomes of acute myocardial infarction in Ontario, 1992–1996. CMAJ. 1999;161:1257–61. [PMC free article] [PubMed] [Google Scholar]
- 38.Bell CM, Redelmeier DA. Mortality among patients admitted to hospitals on weekends as compared with weekdays. N Engl J Med. 2001;345:663–8. doi: 10.1056/NEJMsa003376. [DOI] [PubMed] [Google Scholar]
- 39.Hirsch RP, Riegelman RK. Statistical First Aid: Interpretation of Health Research Data. Oxford, UK: Blackwell Scientific Publications; 2000. Nominal dependent variables; pp. 40–64. [Google Scholar]
- 40.Wasson JH, Sauvigne AE, Mogielnicki RP, et al. Continuity of outpatient medical care in elderly men. A randomized trial. JAMA. 1984;252:2413–7. [PubMed] [Google Scholar]
- 41.Hjortdahl P, Borchgrevink CF. Continuity of care: influence of general practitioners’ knowledge about their patients on use of resources in consultations. Br Med J. 1991;303:1181–4. doi: 10.1136/bmj.303.6811.1181. [DOI] [PMC free article] [PubMed] [Google Scholar]
- 42.O'Malley AS, Mandelblatt J, Gold K, Cagney KA, Kerner J. Continuity of care and the use of breast and cervical cancer screening services in a multiethnic community. Arch Intern Med. 1997;157:1462–70. [PubMed] [Google Scholar]
- 43.Christakis DA, Wright JA, Koepsell TD, Emerson S, Connell FA. Is greater continuity of care associated with less emergency department utilization? Pediatrics. 1999;103(4 pt 1):738–42. doi: 10.1542/peds.103.4.738. [DOI] [PubMed] [Google Scholar]
- 44.Kleinbaum DG, Kupper LL, Morgenstern H. Epidemiologic Research. Belmont, Calif: Lifetime Learning Publications; 1982. Fundamentals of epidemiologic research; pp. 19–39. [Google Scholar]
- 45.Ashton CM, Kuykendall DH, Johnson ML, Wray NP, Wu L. The association between the quality of inpatient care and early readmission. Ann Intern Med. 1995;122:415–21. doi: 10.7326/0003-4819-122-6-199503150-00003. [DOI] [PubMed] [Google Scholar]
- 46.Weissman JS, Ayanian JZ, Chasan-Taber S, et al. Hospital readmissions and quality of care. Med Care. 1999;37:490–501. doi: 10.1097/00005650-199905000-00008. [DOI] [PubMed] [Google Scholar]
- 47.Thomas JW. Does risk-adjusted readmission rate provide valid information on hospital quality? Inquiry. 1996;33:258–70. [PubMed] [Google Scholar]
- 48.Hayward RA, Bernard AM, Rosevear JS, Anderson JE, McMahon LF., Jr An evaluation of generic screens for poor quality of hospital care on a general medicine service. Med Care. 1993;31:394–402. doi: 10.1097/00005650-199305000-00002. [DOI] [PubMed] [Google Scholar]