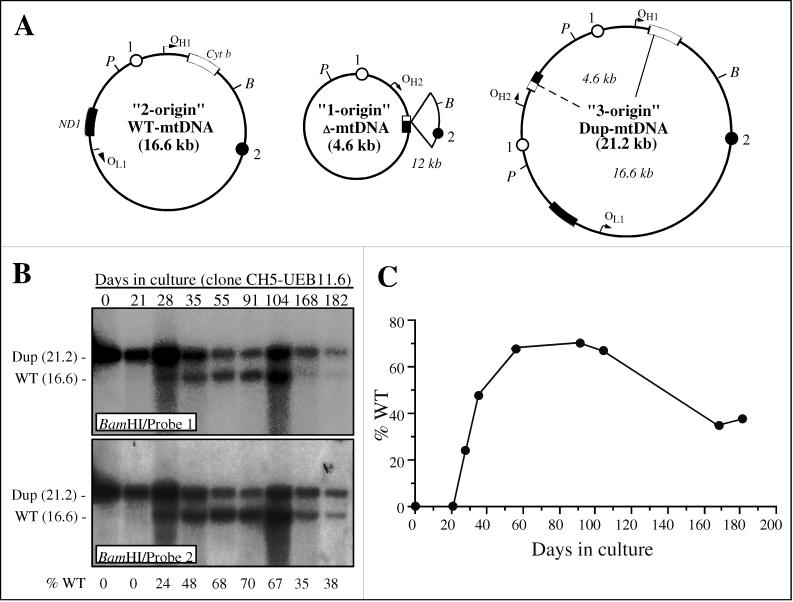
Figure 2.
Long-term culture of a homoplasmic duplication cell line from patient 2. (A) Maps of the relevant mtDNA species. (B) Southern blot analysis of long-term culture of 100% duplication line CH5-UEB11.6. (C) Curve drawn from the % wt-mtDNA (based upon number of molecules) data shown in (B). All other notation as in Figure 1.

