Figure 3.
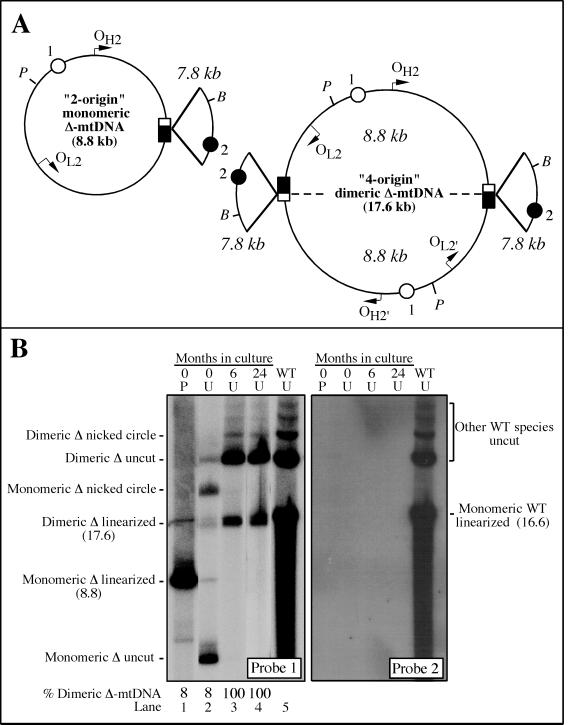
Long-term culture of a homoplasmic deletion cell line from patient 1. (A) Maps of the monomeric and dimeric forms of the Δ-mtDNA species present in 100% deletion lines. One of the two identical pairs of replication origins in the dimer is indicated with prime notation (OH2′ and OL2′). (B) Southern blot analysis of long-term culture of a 100% deletion line (KAF4EB12.49), using either DNA digested partially with PvuII (P; lane 1), or undigested (U; lanes 2–4). The blot was then hybridized first with probe 2 and then with probe 1. The identity of the major hybridizing fragment is indicated at left. Uncut wt-mtDNA was also loaded as a comparative control; the identification of each band is indicated at right. The % dimeric Δ-mtDNA is indicated below. All other notation as in Figure 1.

