Figure 8.
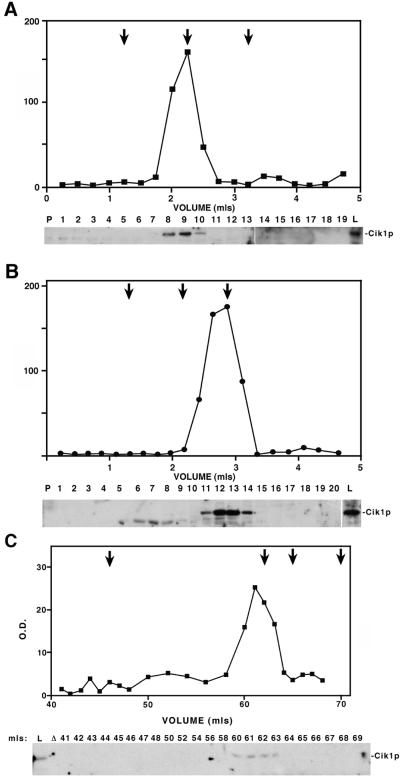
The Kar3p-Cik1p complex has similar size characteristics in vegetatively growing cells to those exhibited in pheromone-treated cells. (A and B) Sucrose density gradient centrifugation was performed on vegetatively growing wild-type KAR3::HAT (Y1870; A) and kar3Δ (Y1700; B) cell lysates. The Cik1 protein from pellets (P), lysates (L), and collected fractions (fraction numbers) were detected by immunoblots probed with anti-Cik1p antibodies. Cik1p on immunoblots was quantified with the use of NIH Image software (version 1.59) to determine the relative optical density of the protein in each lane. This value is pictured plotted against the volume eluted. Marker proteins of known S values were run simultaneously with the lysates, and the peaks at which they eluted are represented by arrows: catalase (11.3S; left arrows), aldolase (7.4S; middle arrows), and BSA (4.4S; right arrows). (C) Peak Cik1p fractions from the wild-type sucrose gradient experiment (fractions 8, 9, and 10 in A) were pooled and fractionated on a Sephacryl S-300 gel filtrationcolumn with the use of FPLC. Cik1p from collected fractions was analyzed on anti-Cik1p immunoblots, and the measured relative optical density of the protein in each fraction is shown plotted against the volume eluted. The arrows indicate mobilities of standard proteins of known Rs (from left to right): thyroglobulin (8.5 nm), catalase (5.3 nm), aldolase (4.8 nm), and BSA (3.5 nm).

