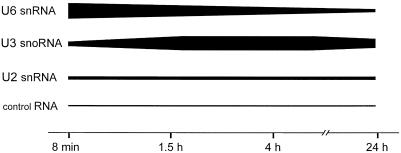
Figure 6.
Schematic representation of nucleolar accumulation of injected RNA. The change in nucleolar labeling over time after injection of U3 snoRNA, U6 snRNA, U2 snRNA or a control RNA into Xenopus oocytes is indicated. The thickness of the black line is proportional to the strength of nucleolar labeling by the injected RNA. Nucleolar labeling by U6 snRNA is initially strong but decreases over the course of 24 h. In contrast, nucleolar labeling by U3 snoRNA increases to a strong signal seen 1.5 h after injection, which is maintained at longer time points. Nucleoli are only weakly stained by U2 snRNA at all time points and are not stained by the 40-nt control RNA.

