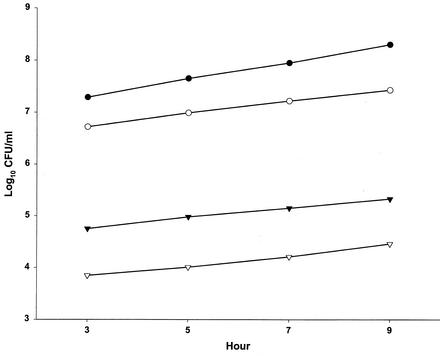
FIG. 2.
Linear log growth over the period from hours 3 to 9 in controls (no antibiotics). Symbols represent L. pneumophila L-1033 at a 1:1 dilution (•) and L-1043 at dilutions of 1:1 (○), 1:100 (▾), and 1:1,000 (▿). Data are the results of 5 to 24 assays; standard deviations were 0.06 and 0.02 log10 CFU/ml per hour for L-1033 and L-1043, respectively.

