Figure 3.
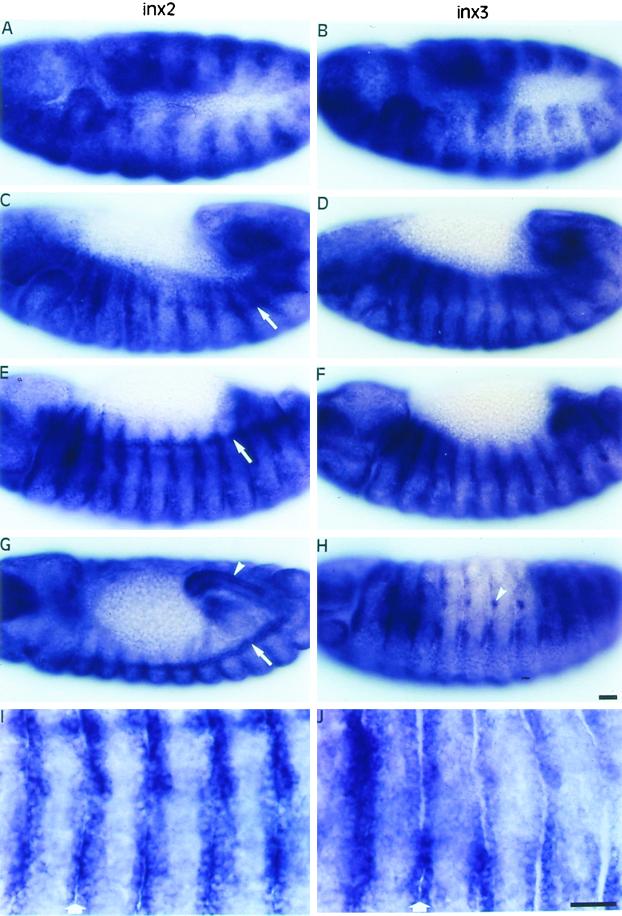
Distribution of inx2 (A, C, E, G, I) and inx3 (B, D, F, H, J) mRNAs during embryogenesis. Anterior is to the left and dorsal is up unless otherwise stated. In germ band extended embryos (stage 11), inx2 (A) and inx3 (B) are expressed in broad segmentally repeated bands. As the germ band retracts (stage 12), expression becomes localized to the segment borders (inx2, C; inx3, D), where it is maintained through stage 13 (inx2, E; inx3, F). In stage 14 embryos, both transcripts were detected in the foregut (out of focus) and hindgut (arrowhead, only shown for inx2, dorsal view, G) and in lateral cell clusters around the spiracular openings (arrowhead, only shown for inx3, H). Unlike inx3, inx2 is expressed in the tracheal system dorsal trunk and the cell placodes that give rise to this structure (arrows, C, E, G). (I) and (J) show regions of epidermis, comprising 5 segments, at higher magnification in stage 13 embryos. The expression of inx2 (I) and inx3 (J) is clearly highest around the segment borders (arrows). Bars, 20 μm.

