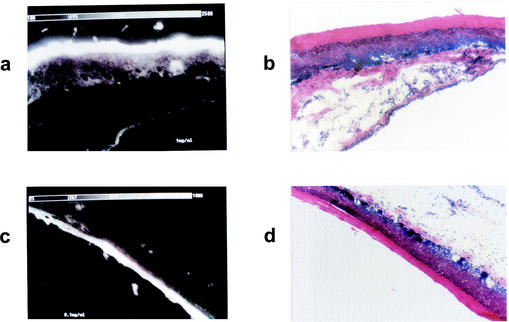
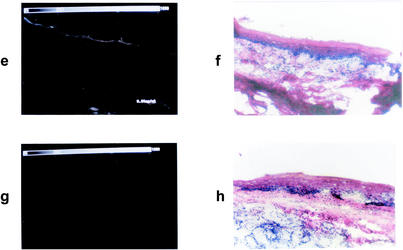
FIG. 4.
Fluorescence microscopy images showing the biodistribution of toluidine blue administered topically to the rat gingiva. (a, c, e, and g) Fluorescence images after application of toluidine blue at 1.0, 0.1, and 0.01 mg/ml and no toluidine blue, respectively. (b, d, f, and h) Corresponding sections stained with hematoxylin-eosin. Scale for each panel, 880 by 550 μm.


