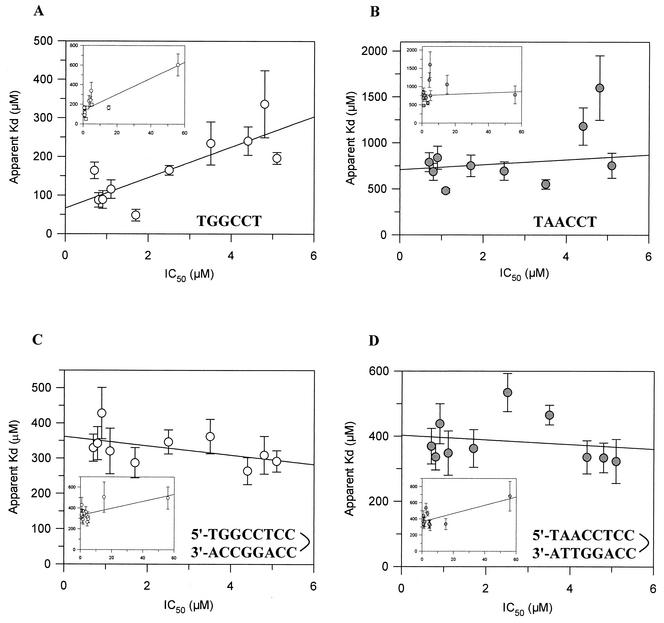
FIG. 4.
Correlations between IC50s and Kdapps for single-stranded and double-stranded DNAs. Correlations were plotted for the single-stranded 990 site sequence of pBR322 (TGGCCT) (A), the single-stranded substituted sequence (TAACCT) (B), the hairpin that formed the 990 site sequence (C), and the hairpin that formed the substituted sequence (D). The plots include all the datum points (insets) or the datum points for just the compounds with cleavage pattern I (main plots). The correlation coefficients for the main plots were as follows: 0.80 (A), 0.54 (B), −0.50 (C), and −0.18 (D).

