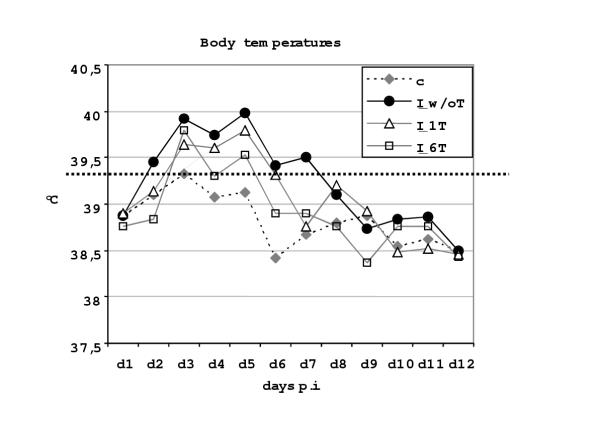
Figure 2.
Average rectal temperatures followed for the first 12 days p.i. in non-infected negative control calves (c), infected and non-medicated positive control calves (I_w/oT), infected and one-day medicated calves (I_1T) and infected and six-day medicated calves (I_6T). The dotted horizontal bar indicates the upper level of the normal body temperature in this age class.

