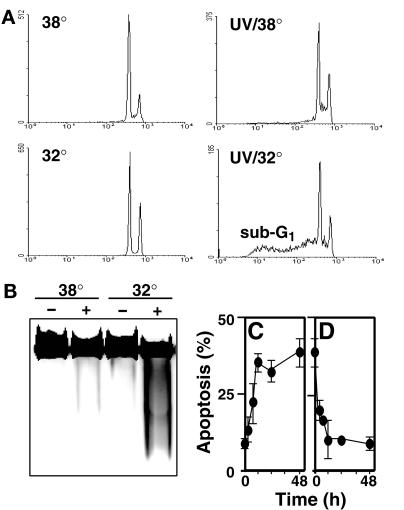
Figure 2.
Post-UV expression of functional p53 enhances UV-induced apoptosis. (A) Flow cytometry diagram of propidium iodide–stained HT29-tsp53 cells maintained at 38°C (upper panels) or switched to 32°C (lower panels) at the time of mock irradiation (left panels) or UV irradiation with 20 J/m2 (right panels). Forty-eight hours after UV irradiation, cells were subjected to flow cytometry analysis, and cells with a sub-G1 DNA content were considered to be apoptotic. (B) HT29-tsp53 cells treated as in A were lysed in the wells of the agarose gel, and the extent of DNA fragmentation was assessed by electrophoresis. The black-and-white image of the ethidium bromide–stained gel has been reversed for clarity. (C) HT29-tsp53 cells were switched to 32°C at the time of UV irradiation and returned to 38°C at various times after UV treatment. Apoptosis was scored as in A and plotted as a function of post-UV incubation time at 32°C. (D) HT29-tsp53 cells were UV irradiated and maintained at 38°C for various periods before switching them to 32°C. Apoptosis was scored as in A and plotted as a function of time between UV irradiation and the switch to 32°C. In C and D, each point represents the mean ± SEM of two to eight independent experiments with background values subtracted. Mean background sub-G1 values varied between 6 and 11%.

