Figure 4.
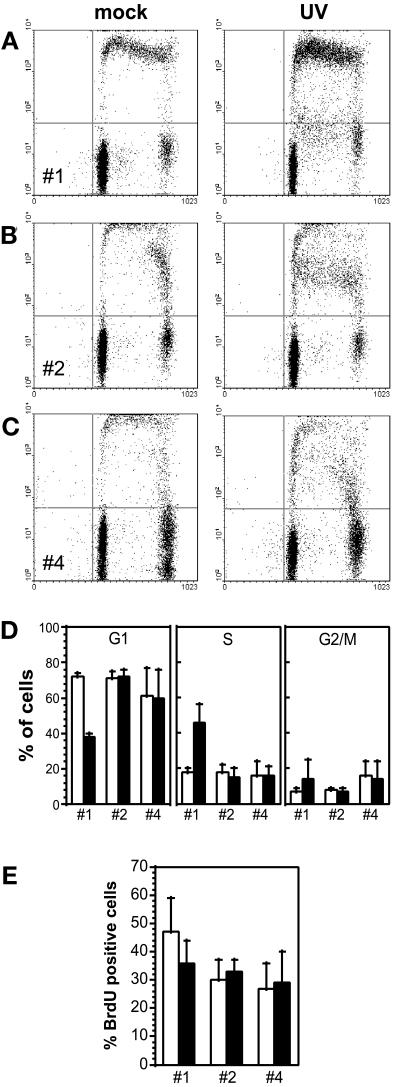
Protection conferred by p53 does not appear to be related to sustained G1 arrest. (A–D) Twenty-four hours after either mock irradiation or UV irradiation with 20 J/m2, BrdU pulse-labeled HT29-tsp53 cells (15-min pulse) were subjected to two-parameter flow cytometry analysis as described in Figure 1. (A) Cells were maintained at 38°C throughout the experiment (protocol 1; Table 1). (B) Cells were switched to 32°C immediately after UV irradiation (protocol 2). (C) Cells were switched to 32°C 24 h before UV irradiation and maintained at 32°C during the post-UV incubation period (protocol 4). (D) The cell cycle distributions (as in A–C) of mock-irradiated (white bars) or UV-irradiated (black bars) HT29-tsp53 cells subjected to protocols 1, 2, and 4 were determined from multiple experiments. (E) HT29-tsp53 cells were subjected to protocols 1, 2, and 4 (Table 1), BrdU labeled continuously for 12 h after mock irradiation or UV irradiation with 20 J/m2, and subjected to two-parameter flow cytometry analysis. Results are expressed as the percentage of cells that entered S phase within 12 h after UV irradiation. Each point in D and E represents the mean ± SE of two to four experiments.

