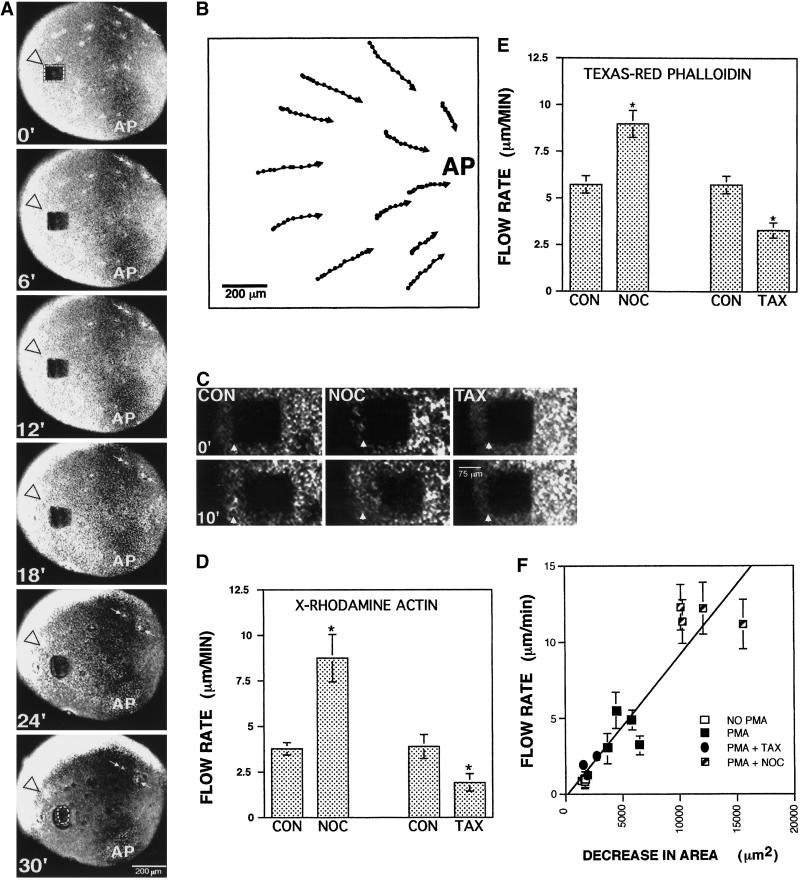
Figure 4.
Microtubules suppress contraction of the cortical F-actin network and flow of cortical F-actin. (A) Low-magnification 4D microscopy analysis of an oocyte injected with X-rhodamine–actin showing the flow of cortical F-actin to the animal pole (AP) of an oocyte bathed in PMA. The dark square (outlined with a dashed line) is a photobleached area that moves toward the animal pole over time. The arrowhead indicates the original position of the upper left corner of the photobleached area. Individual accumulations of cortical F-actin (arrows) can also be seen to move toward the animal pole over time. (B) Vector diagram showing the paths of 12 individual F-actin aggregates over time in an oocyte induced to undergo animal pole–directed cortical flow by global treatment with PMA. Aggregate positions were determined every 2 min. All aggregates flow toward the animal pole. (C) Higher-magnification 4D views of photobleached area movement in control oocytes (CON), oocytes treated with nocodazole (NOC), and oocytes treated with taxol (TAX). Arrowheads indicate the initial starting position of the lower left corner of the photobleached area. Movement of the photobleached area is fastest in nocodazole-treated oocytes and slowest in taxol-treated oocytes. (D) Quantification of F-actin cortical flow rates as determined by 4D analysis of oocytes injected with X-rhodamine–actin and then subjected to microtubule manipulations. Nocodazole more than doubles the rate of F-actin cortical flow, whereas taxol reduces the rate by slightly more than half. Results represent means ± SEM of four independent experiments. The asterisk indicates a p value < 0.05. (E) Quantification of F-actin cortical flow rates as determined by 4D analysis of oocytes injected with Texas Red–X-phalloidin and then subjected to microtubule manipulations. Nocodazole nearly doubles the rate of F-actin cortical flow, whereas taxol reduces the rate by slightly less than half. Results represent means ± SEM of four independent experiments. The asterisk indicates a p value < 0.05. (F) Microtubules suppress contraction of the cortical F-actin network. Rates of F-actin cortical flow plotted versus shrinkage of photobleached areas in oocytes injected with X-rhodamine–actin and then subjected to no treatment (NO PMA), PMA treatment (PMA), PMA treatment after a taxol pretreatment (PMA + TAX), or PMA treatment after a nocodazole pretreatment (PMA + NOC). The rate of cortical flow is proportional to the shrinkage of photobleached areas. PMA plus nocodazole treatment results in increased shrinkage of photobleached areas relative to PMA alone, whereas PMA plus taxol treatment results in decreased shrinkage relative to PMA alone. Virtually no shrinkage (and no cortical flow) is observed in the absence of PMA. Each data point is from a different oocyte; error bars represent means ± SEM of five different cortical flow rate measurements taken for each oocyte.

