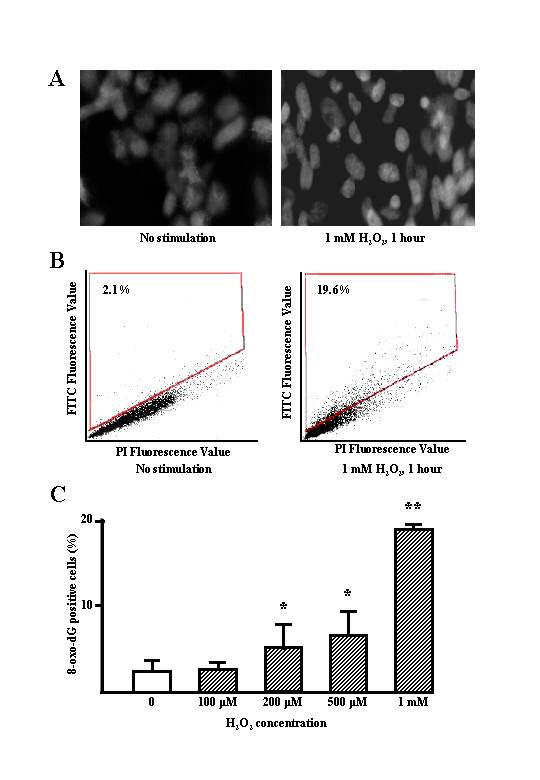
Figure 2.

A, green-fluorescent image of intranuclear 8-oxoguanine expression. WI-26VA4 cells were cultured with and without 1 mM H2O2 for 1 h. The cells were fixed with cold methanol in situ, then stained with a protein, which binds specifically and directly to 8-oxo-dG. B, representative dot plot of DNA content vs. 8-oxo-dG of FITC staining in WI-26VA4 cells treated with or without 1 mM H2O2 for 1 h. Cells were counterstained with PI, and analyzed by laser scanning cytometer. The number in each dot-plot indicates the percentage of 8-oxo-dG positive cells. C, graphic representation of the 8-oxo-dG positive cells that increased in an H2O2 concentration-dependent manner. *, **, significantly different from controls at p < 0.05 and p < 0.01, respectively (Mann-Whitney U-test).
