Figure 3.
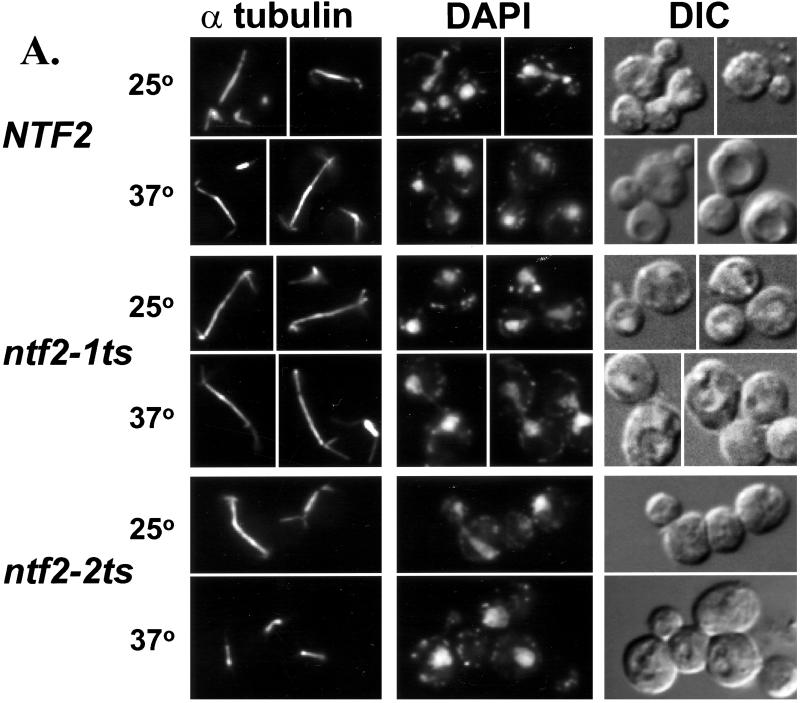
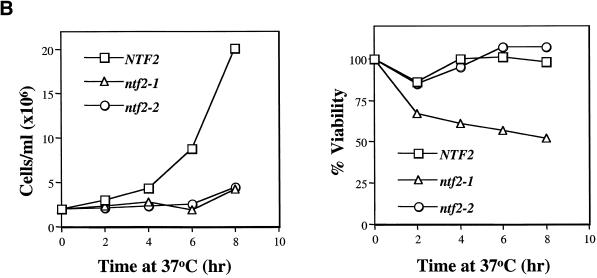
Cell cycle arrest in the ntf2–2ts mutant. (A) Visualization of spindles in NTF2 mutants. NTF2, ntf2–1ts, and ntf2–2ts cells were grown to log phase at 25°C, were split, and were shifted at 25°C or 37°C for 3 h. Cells were stained with antitubulin, to visualize microtubules, and with DAPI, to visualize DNA, as described in Materials and Methods. (B) Growth and viability of NTF2 mutants at 37°C. Cells were grown overnight at 25°C, diluted to 2 × 10⁶ cells/ml, and shifted to 37°C. Samples were removed every 2 h, counted, and 200 cells were plated onto YEPD at 25°C. The results are plotted as cell number versus time at 37°C (left panel) or percent of viability versus time at 37°C (right panel).


