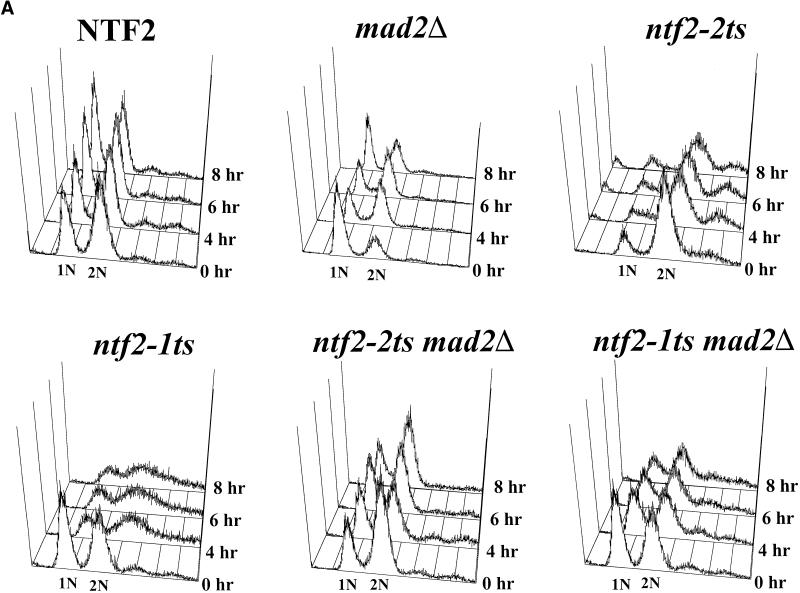
Figure 4.
Analysis of the cell cycle arrest in ntf2–2ts mutant cells. (A) DNA content in NTF2 mutants. NTF2, ntf2–1ts, ntf2–2ts, MAD2Δ, ntf2–2ts MAD2Δ, and ntf2–1ts MAD2Δ cells were grown overnight at 25°C, were diluted to 2 × 10⁶ cells/ml in YEPD, and were shifted to 37°C, and samples were taken at 0, 4, 6, and 8 h. The DNA content of individual NTF2, ntf2–1ts, and ntf2–2ts cells was determined by flow cytometry. (B) Spindle pole body localization in NTF2 mutants. NTF2, ntf2–1ts and ntf2–2ts cells were transformed with a plasmid encoding Nuf2-GFP (Kahana et al., 1995) to visualize spindle pole bodies. Transformed cells were grown to log phase at 25°C and then shifted to 37°C for 3 h. GFP-labeled spindle pole bodies were visualized by direct fluorescent microscopy.


