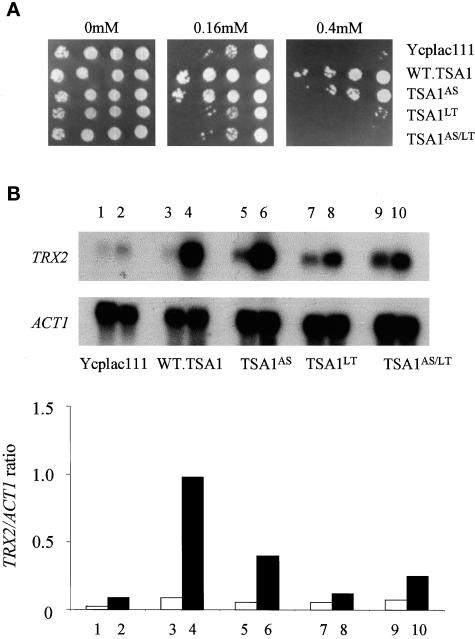
Figure 4.
Analysis of the TSA1 point mutations. (A) Sensitivity of the TSA1 point mutations to tBOOH. Cultures of the tsa1Δ strain containing Ycplac111, WT.TSA1, TSA1AS, TSA1LT, or TSA1AS/LT were grown to midlog phase, and 10-fold serial dilutions were spotted onto SD medium containing various concentrations of tBOOH. (B) H2O2-induced expression of TRX2. Northern blot analysis of RNA isolated from midlog-phase cultures either untreated (lanes 1, 3, 5, 7, and 9) or treated with 0.1 mM H2O2 for 20 min (lanes 2, 4, 6, 8, and 10) with the use of probes specific for the TRX2 and ACT1 transcripts. The tsa1Δ strain contained Ycplac111 (lanes 1 and 2), WT.TSA1 (lanes 3 and 4), TSA1AS (lanes 5 and 6), TSA1LT (lanes 7 and 8), or TSA1AS/LT (lanes 9 and 10). The panel below the Northern blots shows quantitation of the TRX2 transcript level relative to the ACT1 transcript.

