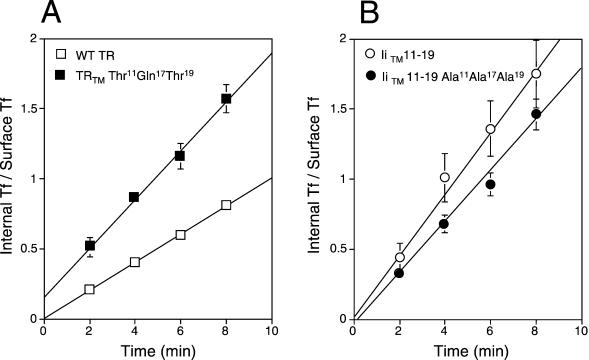
Figure 4.
Comparison of internalization rates of wild-type TR and various TR TM mutants. Equivalent numbers of CEFs expressing wild-type TR and TRTM Thr11Gln17Thr19 (A) or IiTM 11–19 and IiTM 11–19 Ala11Ala17Ala19 chimeras (B) were incubated with prewarmed (37°C) 125I-labeled Tf for indicated times. The amounts of internalized (internal Tf) and surface associated (surface Tf) radiolabel were determined as described under MATERIALS AND METHODS. Data are plotted with IN/SUR method, in which the slope of the line equals the endocytic rate constant ke (Wiley and Cunningham, 1982). The data represent the mean ± SE from five experiments for each time point.

