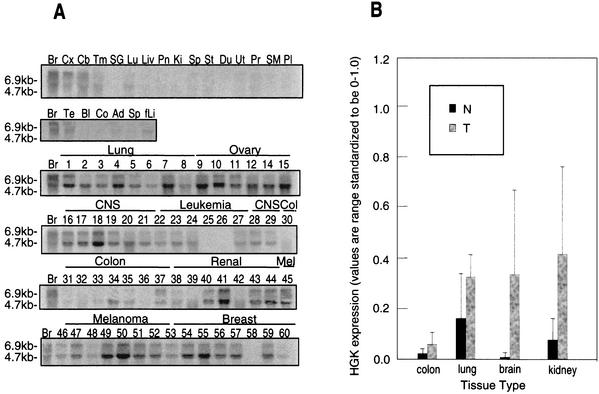
FIG. 2.
(A) HGK mRNA is overexpressed in human tumor cell lines. Total RNA was purified from various human tissues (top two rows) as well as from human tumor cell lines from the standard tumor panel from the National Cancer Institute. Abbreviations for normal tissues: (first row) Br, brain; Cx, cortex; Cb, cerebellum; Tm, thymus; SG, salivary gland; Lu, lung; Liv, liver; Pn, pancreas; Ki, kidney; Sp, spleen; St, stomach; Du, duodenum; Ut, uterus; Pr, prostate; SM, skeletal muscle; Pl, placenta; (second row) Br, brain; Te, testis; Bl, bladder; Co, colon; Ad, adipose tissue; fLi, fetal liver. Numbering for the NCI tumor panel: 1, HOP-92; 2, EKVXl 3, NCI-H23; 4, NCI-H226; 5, NCI-H322; 6, NCI-H460; 7, NCI-H522; 8, A549; 9, HOP-62; 10, OVCAR-3; 11, OVCAR-4; 12, OVCAR-5; 14, IGROV1; 15, SK-OV-3; 16, SNB-19; 17, SNB-75; 18, U251; 19, SF-288; 20, SF-295; 21, SF-539; 22, CCRF-CEM; 23, K-562; 24, MOLT-4; 25, HL-60; 26, RPMI-8226; 27, SR; 28, DU-145; 29, PC-3; 30, HT-29; 31, HCC-2998l; 32, HCT116; 33, SW620; 34, COLO-205; 35, HCT-15; 36, M-12; 37, UO-31; 38, SN12C; 39, A498; 40, Caki-1; 41, RXF-393; 42, ACHN; 43, 786-0; 44, TK-10; 45, LOXIMVI; 46, Malme-3 M; 47, SK-MEL-2; 48, SK-MEL-5; 49, SK-MEL-28; 50, UACC-62; 51, UACC-257; 52, M14; 53, MCF-7; 54, MCF-7/ADR; 55, Hs578T; 56, MDA-MB-231; 57, MDA-MB-431; 58, MDA-N; 59, BT-549, and 60, T-47D. (B) Quantification of HGK in tumor versus normal cells from selected individual tissues. The bar graph shows the relative signal from PhosphorImager quantification of dot blot arrays from tumor cell lines and normal tissues. From left to right: colon tumor-normal, 2.7-fold, P = 0.210; lung tumor-normal, 2.0, P = 0.034; brain tumor-normal, 46.3, P = 0.007; kidney tumor-normal, 5.5, P = 0.076. P values were calculated with the Mann-Whitney test.

