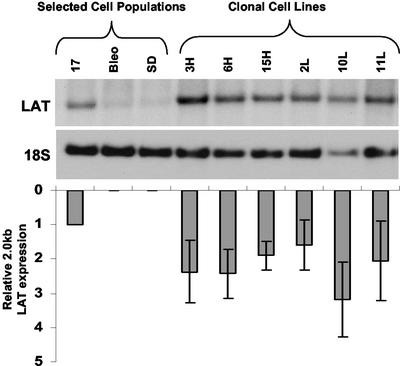
FIG. 4.
Northern hybridization analysis of clonal cell lines derived from the 17 cell population. The blot was sequentially hybridized with LAT and 18S rRNA loading control probes. The graph shows the level of LAT expression in each of the clonal cell lines relative to controls and the parent cell population. Error bars indicate standard error of the mean for three measurements.

