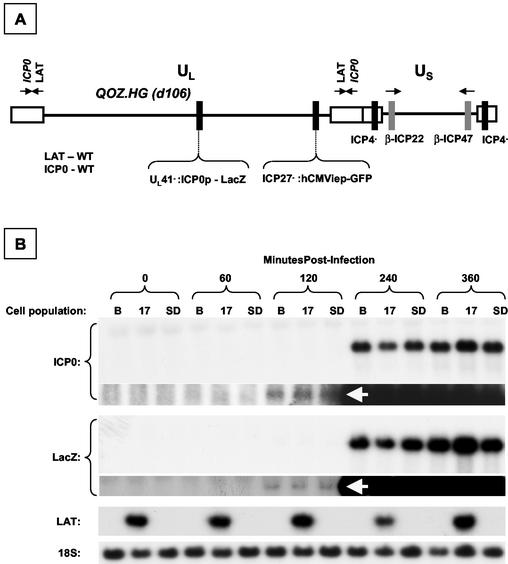
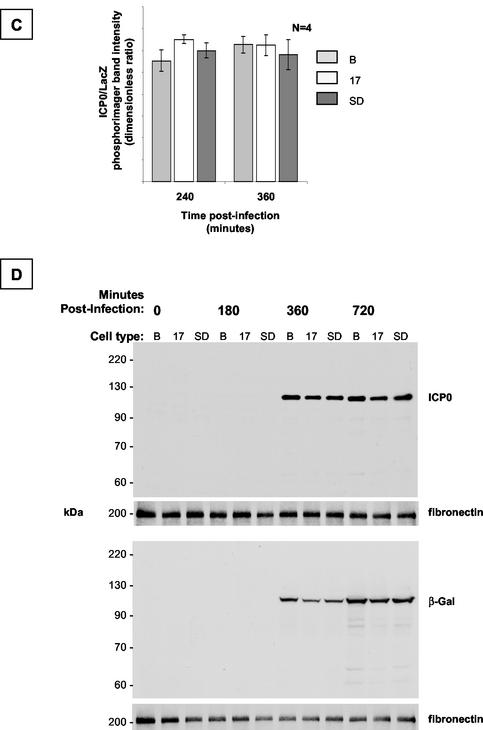
FIG. 7.
Dynamic expression profile of ICP0 and LacZ in LAT-expressing cell populations after infection with QOZ.HG. (A) Schematic depiction of the QOZ.HG genome. The virus contains wild-type LAT and ICP0 loci but does not express LAT, as the viral transcriptional program is disrupted by mutations in the ICP4, -22, and -27 loci. (B) Northern blot hybridization analysis of ICP0, LacZ, and LAT expression in LAT-expressing and control cell populations before and at four time points after infection with QOZ.HG. The second and fourth panels show prolonged exposures of the blots depicted in the first and third panels. ICP0 and LacZ mRNAs appear at 120 min postinfection (arrows) in all cell populations and peak at similar levels. (C) Quantitative analysis of the ICP0/LacZ ratio provides a surrogate marker of ICP0 stability (see the text). This is not altered by the presence or absence of the 2.0-kb LAT at any time point. (D) Western blot hybridization analysis of ICP0 and LacZ protein expression in LAT-expressing cell populations and controls before and after infection with QOZ.HG. The upper two and lower two panels represent duplicate blots that were probed for ICP0 or LacZ and then stripped and reprobed for the fibronectin loading control. B, Bleo.


