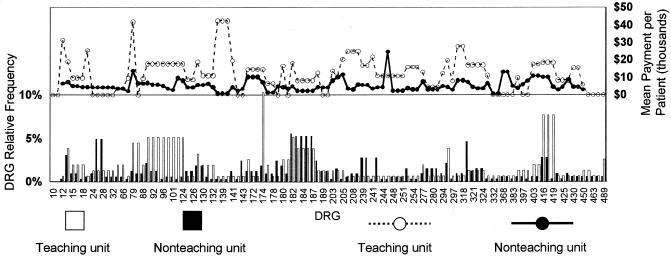
Figure 4.
Distribution of drug-related group (DRG) for patients of nonteaching physicians on the teaching and nonteaching units. Relative frequency and median payment for each DRG are shown. The bars in the lower part of the figure indicate relative frequency of DRGs in the two patient groups. The lines in the upper part of the figure indicate median payment for each DRG in the two patient groups.

