Abstract
OBJECTIVE
To compare strategies for diagnosing cancer in primary care patients with low back pain. Strategies differed in their use of clinical findings, erythrocyte sedimentation rate (ESR), and plain x-rays prior to imaging and biopsy.
DESIGN
Decision analysis and cost effectiveness analysis with sensitivity analyses. Strategies were compared in terms of sensitivity, specificity, and diagnostic cost effectiveness ratios.
SETTING
Hypothetical
MEASUREMENTS
Estimates of disease prevalence and test characteristics were taken from the literature. Costs were represented by the Medicare reimbursement for the tests and procedures employed.
MAIN RESULTS
In the baseline analysis, using magnetic resonance imaging (MRI) as the imaging procedure prior to a single biopsy, strategies ranged in sensitivity from 0.40 to 0.73, with corresponding diagnostic costs of $14 to $241 per patient and average cost effectiveness ratios of $5,283 to $49,814 per case of cancer found. Incremental cost effectiveness ratios varied from $8,397 to $624,781; 5 strategies were dominant in the baseline analysis. Use of a higher ESR cutoff point (50 mm/hr) improved specificity and cost effectiveness for certain strategies. Imaging with MRI, or bone scan followed in series by MRI, resulted in a fewer unnecessary biopsies than imaging with bone scan alone. Cancer prevalence was an important determinant of cost effectiveness.
CONCLUSIONS
We recommend a strategy of imaging patients who have a clinical finding (history of cancer, age ≥50 years, weight loss, or failure to improve with conservative therapy) in combination with either an elevated ESR (≥50 mm/hr) or a positive x-ray, or using the same approach but imaging directly those patients with a history of cancer.
Keywords: low back pain, decision analysis, cost–effectiveness analysis
Low back pain is a common complaint among primary care outpatients; estimates of the cumulative lifetime prevalence range from 13.8% for persistent pain1 to as high as 80% for any episode of pain.2 In the majority of cases of back pain, a specific diagnosis is not made,3 and patients usually recover within a few weeks of the onset of symptoms.4
An important goal of diagnostic testing is to identify the serious systemic causes of back pain, such as malignancy, infection, and inflammatory disease.3,5 Although malignancy is the most common of these systemic problems,5 the prevalence of spinal malignant neoplasms (usually metastatic disease) among primary care patients with low back pain is less than 1%.6 An important goal of early diagnosis and treatment of spinal metastasis is to prevent complications, which may include pain, pathologic fracture, weakness, sensory loss, paralysis, and bowel or bladder dysfunction.7,8 Among patients who develop epidural spinal cord compression, those who are diagnosed early, while still able to ambulate, are the most likely to remain ambulatory following treatment.9,10 The ideal diagnostic strategy would detect the few cases of cancer among primary care patients with low back pain, while minimizing unnecessary diagnostic testing.
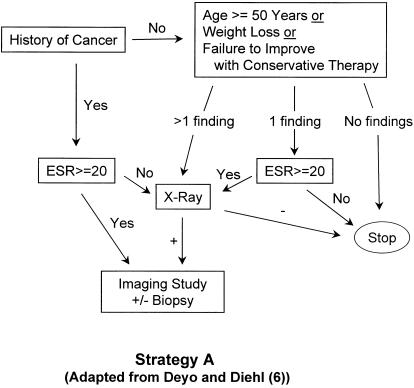
Several strategies have been proposed for detecting spinal malignancy in patients with back pain and a known history of cancer9,11; these strategies may involve exhaustive testing to rule out spinal malignancy with a high degree of certainty.9 However, only one large study has addressed the issue in a primary care population. In that study, Deyo and Diehl6 looked at 1,975 patients with a chief complaint of back pain who presented for care to the walk-in clinic of a public hospital; only 13 (0.66%) of those patients were found to have cancer as the underlying cause. The four clinical findings with the highest likelihood ratios for predicting cancer were a previous history of cancer, age 50 years and older, failure to improve with conservative therapy (having sought medical care within the past month and not improving), and unexplained weight loss of more than 10 pounds in 6 months. In their study, all patients with cancer had at least 1 of these 4 findings. Deyo and Diehl6 proposed an algorithm (see Fig. 1(A)) for detecting cancer which employed these clinical findings, Westergren erythrocyte sedimentation rate (ESR), and plain spine radiographs (x-rays).
FIGURE 1(A).
Strategy A (“selective testing”), adapted from Deyo and Diehl6 with the addition of imaging and biopsy. Strategy A2 (“revised selective testing”) is identical to Strategy A except that patients with a history of cancer go directly to imaging. ESR indicates erythrocyte sedimentation rate.
In our analysis, we used decision analytic methods to compare several diagnostic strategies, including the above-mentioned algorithm, for finding cancer in primary care patients with low back pain. We assumed that these patients had no red flags12 for other potentially serious conditions such as cauda equina syndrome, spinal fracture, or infection. Strategies were compared in terms of overall sensitivity, specificity, and diagnostic cost effectiveness. Costs were represented by the year 2000 Medicare reimbursement for the tests and procedures employed, and therefore represent the payer's perspective. Effectiveness was defined as cases of cancer found. The costs of treatment were not included in our analysis.
Most spinal malignancies are metastatic; primary tumors include breast, lung, and prostate cancers, lymphoma, myeloma, and a number of other types.13 Following Deyo and Diehl,6 we considered the various forms of metastatic and primary cancers together as a group for the purpose of this analysis. The term “spinal cancer” therefore comprises a collection of neoplasms, each with its own natural history and clinical features, but similar in their association with back pain. The specific management and prognosis of these disorders depend upon the particular diagnosis.
METHODS
Strategies
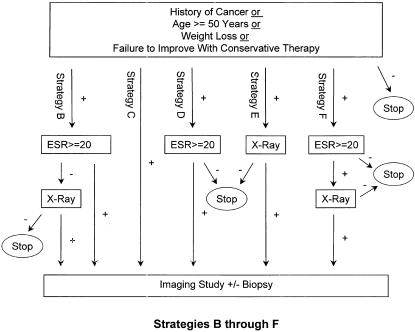
We constructed 11 clinically plausible diagnostic strategies (Fig. 1), designated Strategy A through Strategy F2, for diagnosing cancer as a cause of low back pain. Strategies differed in the choice and arrangement of clinical findings, ESR, and x-ray prior to imaging and possible biopsy. Bone scan and magnetic resonance imaging (MRI) were considered imaging studies for the purpose of this analysis. Strategy A is the published Deyo and Diehl6 algorithm, adapted by the addition of imaging and biopsy. Strategies A2, B2, D2, E2, and F2 are identical to Strategies A, B, D, E, and F, respectively, except that patients with back pain and a known history of cancer are directed immediately to imaging without intervening workup. In addition to the letter designations, brief descriptive labels for the strategies are used for reference throughout this paper (see,Fig. 1).
FIGURE 1(B).
Strategies B (image if ESR+ or x-ray+), C (image everyone), D (image if ESR+), E (image if x-ray+), and F (image if ESR+ and x-ray+). Note that Strategies B2 (image if HxCa+ or ESR+ or x-ray+), D2 (image if HxCa+ or ESR+), E2 (image if HxCa+ or x-ray+), and F2 (image if HxCa+ or both ESR+ and x-ray+) are identical to Strategies B, D, E, and F respectively except that patients with a history of cancer (HxCa+) go directly to imaging. ESR indicates erythrocyte sedimentation rate.
Diagnostic Tests
Clinical Findings
We employed the 4 clinical findings identified by Deyo and Diehl6 as the strongest predictors of cancer in patients with back pain; these included previous history of cancer, age greater than or equal to 50 years, failure to improve with conservative therapy, and unexplained weight loss. Base estimates of the sensitivity and specificity of each clinical finding were taken from Deyo and Diehl,6 and incorporated under an assumption of conditional independence (Table 1). Confidence intervals were computed on these proportions using the data presented in their published paper, and the extremes of the 95% confidence intervals were used in the sensitivity analysis.
Table 1.
Clinical Findings and Diagnostic Tests Used in the Decision Model
| Sensitivity (range) | Specificity (range) | Cost (range)§ | |
|---|---|---|---|
| Clinical finding | |||
| History of cancer* | 0.31 (0.10 to 0.61) | 0.98 (0.97 to 0.99) | |
| Age ≥ 50 years* | 0.77 (0.46 to 0.94) | 0.71 (0.69 to 0.73) | |
| Failure to improve with conservative therapy* | 0.31 (0.10 to 0.61) | 0.90 (0.89–0.91) | |
| Weight loss* | 0.15 (0.03 to 0.46) | 0.94 (0.93 to 0.95) | |
| Any one or more of above† | 0.91 (0.58 to 0.99) | 0.59 (0.55 to 0.63) | |
| Diagnostic test: | |||
| ESR ≥ 20* | 0.78 | 0.67 | $5 (5 to 50) |
| ESR ≥ 50* | 0.56 | 0.97 | $5 (5 to 50) |
| Lumbosacral x-ray* | 0.70 | 0.95 | $38 (10 to 100) |
| Bone scan‡ | 0.95 | 0.70 | $211 |
| Lumbar MRI | 0.95 (0.85 to 1.00) | 0.95 | $562 (100 to 1200) |
| Biopsy under fluoroscopic guidance | 0.85 | 1.00 | $297 (100 to 1200) |
Erythrocyte Sedimentation Rate and Plain X-rays
We used estimates of sensitivity and specificity from Deyo and Diehl6 for ESR in detecting spinal cancer (Table 1). In the baseline analysis, we employed an ESR cutoff point of 20 mm/hr; in the sensitivity analysis, we examined the effect of a higher cutoff point of 50 mm/hr. We also used their estimates of x-ray sensitivity and specificity (Table 1), when a positive x-ray was defined as the presence of a compression fracture or a lytic or blastic lesion.
Imaging test
Lumbar MRI was the imaging study employed in the baseline analysis. In the sensitivity analysis, we examined the alternatives of imaging with bone scan alone or bone scanfollowed in series by MRI. (With serial imaging, MRI is obtained only if the bone scan is positive.) Magnetic resonance imaging is both sensitive and specific in detecting cancer of the spine; Li and Poon14 reported a sensitivity of 93% and specificity of 97% for MRI in detecting malignant spinal cord compression in patients with known primary malignancy. Magnetic resonance imaging provides anatomical detail, and is felt by some authorities to be an excellent noninvasive alternative to myelography and the best choice for imaging when spinal cancer is suspected.15,16 Bone scanning is sensitive but not specific for cancer of the spine,17 and finds cancer at an earlier stage than plain.18 Estimates of the test characteristics of bone scan vary. Corcoran et al.19 reported that solitary bone scan abnormalities had a positive predictive value of only 64% for metastatic disease in a group of patients with known extraosseous malignancies. Other estimates for bone scan include a sensitivity of 0.98 for bone metastases20; a sensitivity of 0.82 and specificity of 0.70 for spinal pathology21; a sensitivity of 0.97 and specificity of 0.84 for occult malignancy in patients with musculoskeletal pain22; and a sensitivity of 0.74, specificity of 0.81, and positive predictive value of 64% for vertebral metastasis in patients with back pain.23 Several studies have shown MRI to be more sensitive than bone scan in detecting spinal metastases24,25; however,bone scan can potentially detect lesions in skeletal areas other than the back. We used an estimated sensitivity of 0.95 and specificity of 0.95 for MRI in our baseline analysis. For bone scan, we assumed an equivalent sensitivity of 0.95 but a lower specificity of 0.70, corresponding to the estimates of Mazanec.26
Biopsy
Percutaneous vertebral biopsy is usually done using either fluoroscopy or CT guidance. Estimates of the diagnostic yield vary,21,27–32 and sensitivity appears to range from around 70% to none than 90% for detecting pathology including malignancy and infection. Such studies typically have reported no false positive results from biopsy. In our analysis, we used a sensitivity of 0.85 and specificity of 1.00 for a single biopsy under fluoroscopic guidance.
The risk of serious complications of vertebral needle biopsy appears small when performed by experienced practitioners, but should not be ignored. Estimates of the complication rate for vertebral biopsy vary. Two large case series, one that included 941 vertebral needle biopsies,28 the other 469 trephine biopsies,30 reported no important complications; smaller series33,34 have reported complication rates of 2.2% to 2.5%. In our baseline analysis, we assumed no biopsy complications. In the sensitivity analysis, we varied the cost of biopsy to allow for complications.
Costs
We used the year 2000 Medicare reimbursement amounts,35 averaged nationwide across carriers and localities, as costs for the tests and procedures employed in the strategies (Table 1). For the radiologic studies, the cost included both a professional and a technical component. The total cost of vertebral needle biopsy included charges for fluoroscopy, biopsy, decalcification of tissue, and histologic exam. We assumed 2-view plain lumbosacral x-rays, uncontrasted lumbar MRI scan, and total body bone scan in determining costs. In the sensitivity analysis, we varied the cost of ESR, x-ray MRI, and biopsy (see Table 1). Diagnostic costs only were considered in our analysis; the costs of treatment were not included. We also excluded the cost of any additional testing or therapy associated with incidental abnormalities found on MRI scanning.
Analysis
Baseline Analysis
Strategies were formulated as decision trees and analyzed using Decision Maker 7.07 (Sonnenberg, Pauker, and Wong, Boston, Mass). Strategy sensitivity was defined as the proportion of patients with spinal malignancy who were correctly identified following workup and biopsy. Because biopsy was assigned a specificity of 1.0, with no false-positive biopsy findings, strategy specificity was defined as the proportion of patients without spinal malignancy who were spared a biopsy. A false-positive by this definition is a patient without cancer who undergoes unnecessary biopsy. The average cost effectiveness ratio for each strategy was calculated as the total cost divided by the number of cases of cancer found.36,37 Strategies were arranged in order of increasing cost, and incremental cost effectiveness ratios were computed as the increase in cost divided by the number of additional cases found in going from one strategy to the next most expensivestrategy.36,37
A set of dominant strategies was then identified using incremental cost effectiveness ratios and the principles of simple and extended dominance. A strategy is dominated if it is both more costly and less effective than an alternative strategy.38 A strategy is dominated by extended dominance when a more effective alternative strategy has a lower incremental cost effectiveness ratio.38
Sensitivity Analysis
In the sensitivity analysis we examined the effect of imaging with bone scan alone or bone scan followed in series by MRI, using the higher ESR cutoff point of 50 mm/hr, and repeating the biopsy when the initial biopsy is negative. We also examined the impact of cancer prevalence, MRI sensitivity, costs of testing, and the use of low or high estimates of the sensitivity and specificity of the clinical findings. Unless otherwise stated, sensitivity analyses assumed the following: an ESR cutoff point of 20 mm/hr; base estimates of the sensitivity and specificity of clinical findings, x-ray, and biopsy (see Table 1); base estimates of costs; a prevalence of 0.66% for spinal malignancy; MRI as the imaging test with estimated sensitivity of 0.95 and specificity of 0.95; and a single biopsy.
RESULTS
Baseline Analysis
A comparison of dominant strategies in order of increasing cost is shown in Table 2. Strategy sensitivity ranged from 0.400 for Strategy F (image if ESR+ and x-ray) to 0.732 for strategy C (image everyone), and strategy specificity from 0.9997 to 0.9794. A total of 3.4 to 26.1 biopsies per 1,000 patients were performed to find 2.6 to 4.8 cases of cancer.
Table 2.
Comparison of the Five Dominant Strategies in the Baseline Analysis*
| Strategy | Description | Strategy Sensitivity | Strategy Specificity† | Cases Found Per 1,000 Patients | Cases Missed Per 1,000 Patients | Patients Biopsied Without Cancer Per 1,000 Patients | Total Number of Biopsies Per 1,000 Patients | Cost Per Patient | Cost Per Case Found | Incremental Cost Per Additional Case Found |
|---|---|---|---|---|---|---|---|---|---|---|
| F | Image if ESR+ and XR+ | 0.400 | 0.9997 | 2.6 | 4.0 | 0.3 | 3.4 | $14 | $5,283 | |
| A | Selective testing | 0.525 | 0.9992 | 3.5 | 3.1 | 0.8 | 4.8 | $21 | $6,026 | $8,397 |
| E2 | Image if HxCA+ or x-ray+ | 0.588 | 0.9980 | 3.9 | 2.7 | 2.0 | 6.5 | $42 | $10,706 | $50,020 |
| B2 | Image if HxCa+ or ESR+ or x-ray+ | 0.701 | 0.9919 | 4.6 | 2.0 | 8.1 | 13.5 | $110 | $23,703 | $91,428 |
| C | Image everyone | 0.732 | 0.9794 | 4.8 | 1.8 | 20.4 | 26.1 | $241 | $49,814 | $624,781 |
Assuming magnetic resonance imaging (MRI) as imaging test, ESR cutoff point of 20, prevalence of cancer 0.66%, baseline estimates of sensitivities and specificities, baseline estimates of costs, and a single biopsy. Strategies are arranged in order of increasing cost. ESR, erythrocyte sedimentation rate; HxCa indicates history of cancers.
Defined as proportion of patients without spinal malignancy who were spared a biopsy.
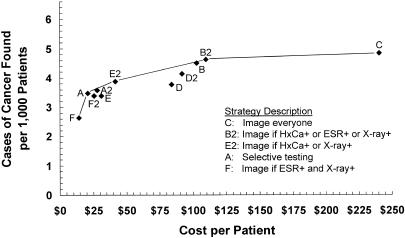
Diagnostic cost per patient ranged from $14 to $241, average cost effectiveness ratios from $5,283 to $49,814 per case of cancer found, and incremental cost effectiveness ratios from $8,397 to $624,781. Figure 2 shows strategy effectiveness versus diagnostic cost per patient for the baseline analysis; when plotted in this manner, strategies that are dominant in terms of incremental cost effectiveness ratios form a, “frontier” and strategies that are dominated lie below and to the right of this frontier.36,38,39 The five dominant strategies in order of increasing effectiveness included Strategy F (image if ESR+ and x-ray), Strategy A (selective testing), Strategy E2 (image if HxCa+ or x-ray+), Strategy B2 (image if HxCa+ or ESR+ or x-ray+), and Strategy C (“image everyone”). Strategies A2 (revised selective testing) and B (image if ESR+ or x-ray+) were close to, but below, the frontier.
FIGURE 2.
Strategy effectiveness versus cost in the baseline analysis. Solid line indicates the frontier of dominant strategies; dominated strategies lie below and to the right of the frontier. HxCa indicates history of cancer; ESR, erythrocyte sedimentation rate.
Sensitivity Analysis
Choice of imaging tests
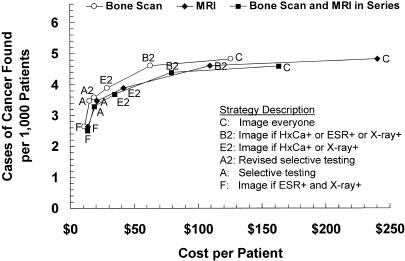
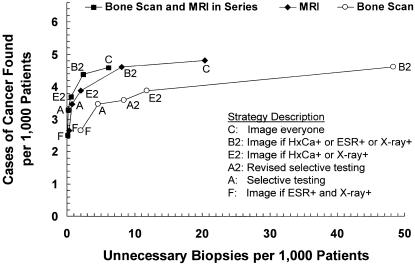
Figure 3 compares the 3 choices of imaging: MRI alone (the baseline assumption), bone scan alone, or bone scan followed in series by MRI. Imaging with bone scan alone achieved the lowest diagnostic costs ($11 to $126 per patient, $4,142 to $26,009 per case found), but resulted in substantially more unnecessary biopsies (2.0 to 122.6 per 1,000 patients to find 2.6 to 4.8 cases of cancer). Serial imaging with bone scan followed by MRI was less sensitive than imaging with MRI alone, cost less than MRI alone ($13 to $163 per patient, $5,263 to $35,514 per case found), and generated the least number of unnecessary biopsies (0.1 to 6.1 per 1,000 patients to find 2.5 to 4.6 cases of cancer).
FIGURE 3(A).
Strategy effectiveness versus cost for 3 imaging options; magnetic resonance imaging (MRI) (the baseline assumption), bone scan, and bone scan followed in series by MRI. Dominant strategies only are shown for each imaging option.
Repeat biopsy
When a negative biopsy was followed by repeat biopsy, strategy sensitivity as expected increased by 15%. For dominant strategies, cost per patient increased by 1.7% to 2.6%, and cost per case found decreased by about 11%, from the baseline costs. Compared with a single biopsy, repeating the biopsy incurred incremental costs of $603 per additional case found for strategy F (image if ESR+ and x-ray+), $786 for strategy A (selective testing), $1,355 for strategy E2 (image if HxCa+ or x-ray+), $3,807 for strategy B2 (image if HxCa+ or ESR+ or x-ray+), and $8,732 for strategy C (image everyone).
Erythrocyte Sedimentation Rate Cutoff Point
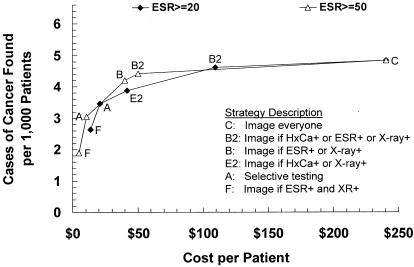
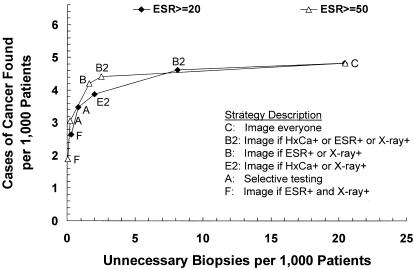
Using an ESR cutoff point of 50 mm/hr rather than 20 mm/hr resulted in lower costs (Fig 4A) and fewer unnecessary biopsies (Figure 4B) for strategies that employed ESR. Strategy B (image if ESR+ or x-ray+) was included among the dominant strategies when the higher ESR cutoff point was used, and Strategy E2 (image if HxCa+ or x-ray+) was dominated. Strategies B (image if ESR+ or x-ray+) and B2 (image if HxCa+ or ESR+ or x-ray+) were slightly less sensitive (0.05 and 0.03 absolute decrements respectively) but were less than half as costly using the higher ESR cutoff point of 50 mm/hr. The loss of sensitivity for these two strategies was tempered by the parallel arrangement of ESR and x-ray. Strategy B (image if ESR+ or x-ray+) found 4.2 cases of cancer and generated 1.6 unnecessary biopsies per 1,000 patients, at a cost of $40 per patient and $9,525 per case of cancer found; ESR was obtained in 41.5% of patients, and x-ray in 39.9%. Strategy B2 (image if HxCa+ or ESR+ or x-ray+) found 4.4 cases of cancer and generated 2.5 unnecessary biopsies per 1,000 patients, at a cost of $50 per patient and $11,302 per case of cancer found; ESR was obtained in 39.3% of patients, and X-ray in 37.9%.
FIGURE 4(A).
Strategy effectiveness versus cost for erythrocyte sedimentation rate (ESR) cutoff points of 20 mm/hr (the baseline assumption) and 50 mm/hr. Dominant strategies only are shown for each ESR cutoff point.
FIGURE 4(B).
Strategy effectiveness versus false positive (unnecessary biopsy) rate for ESR cutoff points of 20 mm/hr (the baseline assumption) and 50 mm/hr. Dominant strategies only are shown for each ESR cutoff point.
Using an ESR cutoff point of 20 rather than 50 mm/hr incurred an incremental cost of $12,068 per additional case found for Strategy F (image if ESR+ and x-ray+), $24,927 for Strategy A (selective testing), $197,002 for Strategy B (image if ESR+ or x-ray+) and $284,352 for Strategy B2 (image if HxCa+ or ESR+ or x-ray+).
Combinations of Erythrocyte Sedimentation Rate Cutoff Point and Imaging Options
Table 3 summarizes the costs, cases found, and unnecessary biopsies for the 6 combinations of ESR cutoff point and choice of imaging. Use of the higher ESR cutoff point with bone scan or serial imaging further improved strategy specificity for strategies that employed ESR, and strategy D2 (image if HxCa+ or ESR+) was included among dominant strategies.
Table 3.
Summary of Dominant Strategies for Each ESR Cutoff Point and Choice of Imaging*
| MRI | Bone Scan | Bone Scan and MRI In Series | |||||||||||
|---|---|---|---|---|---|---|---|---|---|---|---|---|---|
| Strategy | Description | Cases Found per 1,000 Patients | FP per 1,000 Patients | Cost per Patient, $ | Cost per Case Found, $ | Cases Found per 1,000 Patients | FP per 1,000 Patients | Cost per Patient, $ | Cost per Case Found, $ | Cases Found/1,000 Patient | FP per 1,000 Patients | Cost per Patient, $ | Cost per Case Found, $ |
| ESR cutoff point 20 mm/hr | |||||||||||||
| F | Image if ESR+ and x-ray+ | 2.6 | 0.3 | 14 | 5,283 | 2.6 | 2.0 | 11 | 4,142 | 2.5 | 0.1 | 13 | 5,263 |
| A | Selective testing | 3.5 | 0.8 | 21 | 6,026 | 3.5 | 4.6 | 15 | 4,377 | 3.3 | 0.2 | 19 | 5,673 |
| A2 | Revised selective testing | — | — | — | — | 3.6 | 8.4 | 18 | 5,150 | — | — | — | — |
| E2 | Image if HxCa+ or x-ray+ | 3.9 | 2.0 | 42 | 10,706 | 3.9 | 11.8 | 29 | 7,470 | 3.7 | 0.6 | 35 | 9,435 |
| B2 | Image if HxCa+ or ESR+ or x-ray+ | 4.6 | 8.1 | 110 | 23,703 | 4.6 | 48.4 | 63 | 13,631 | 4.4 | 2.4 | 80 | 18,102 |
| C | Image everyone | 4.8 | 20.4 | 241 | 49,814 | 4.8 | 122.6 | 126 | 26,009 | 4.6 | 6.1 | 163 | 35,514 |
| ESR cutoff point 50 mm/hr | |||||||||||||
| F | Image if ESR+ and x-ray+ | 1.9 | 0.03 | 5 | 2,617 | 1.9 | 0.2 | 4 | 2,094 | 1.8 | 0.01 | 5 | 2,910 |
| A | Selective testing | 3.1 | 0.2 | 11 | 3,473 | 3.1 | 1.3 | 8 | 2,635 | 2.9 | 0.1 | 10 | 3,580 |
| D2 | Image if HxCa+ or ESR+ | — | — | — | — | 3.4 | 9.5 | 13 | 3,932 | 3.3 | 0.5 | 18 | 5,626 |
| B | Image if ESR+ or x-ray+ | 4.2 | 1.6 | 40 | 9,525 | 4.2 | 9.6 | 29 | 6,977 | 4.0 | 0.5 | 35 | 8,696 |
| B2 | Image if HxCa+ or ESR+ or x-ray+ | 4.4 | 2.5 | 50 | 11,302 | 4.4 | 15.1 | 34 | 7,712 | 4.2 | 0.8 | 41 | 9,803 |
| C | Image everyone | 4.8 | 20.4 | 241 | 49,814 | 4.8 | 122.6 | 126 | 26,009 | 4.6 | 6.1 | 163 | 35,514 |
Assumptions include base estimates of sensitivity and specificity of clinical findings, x-ray, and biopsy; base estimates of costs; and a single biopsy. FP indicates false positives (unnecessary biopsies); HxCa indicates history of cancer; ESR , erythrocyte sedimentation rate; MRI magnetic resonance imaging.
Sensitivity of Imaging Test
Overall strategy sensitivity increased with increasing sensitivity of the imaging test, but was limited by the structure of the strategy and the assumed 85% sensitivity of biopsy. An assumed MRI sensitivity of 0.85 resulted in strategy sensitivities ranging from 0.36 to 0.65, average cost effectiveness ratios from $5,863 to $55,633, and incremental cost effectiveness ratios from $9,343 to $698,243. Even with a perfect MRI sensitivity of 1.0, strategy sensitivities ranged from 0.42 to 0.77, average cost effectiveness ratios from $5,036 to $47,340, and incremental cost effectiveness ratios from $7,994 to $593,559.
Prevalence of Spinal Malignancy
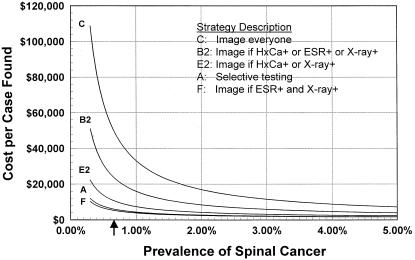
The prevalence of spinal malignancy had a dramatic effect upon the cost effectiveness of the strategies (Fig. 5). The average and incremental cost effectiveness ratios for all strategies decreased with increasing prevalence of spinal malignancy. At a cancer prevalence of 1.69%, all strategies had average cost effectiveness ratios of less than $20,000 per case found, with incremental cost effectiveness ratios from $3,859 to $241,957. At a cancer prevalence of 7.58%, all strategies had average cost effectiveness ratios of less than $5,000 per case found, with incremental cost effectiveness ratios of $1,599 to $51,344. Cost per patient, as expected, increased with increasing cancer prevalence.
FIGURE 5.
Average cost effectiveness as a function of prevalence of spinal cancer. The arrow indicates the prevalence of 0.66% used in the baseline analysis. HxCa indicates history of cancer; ESR, erythrocyte sedimentation rate.
The estimated cancer prevalence of 0.66% used in our baseline cost effectiveness analysis falls in the steeper portion of the curves presented in Figure 5. In this area of the graph, a small change in the prevalence of disease has a substantial impact upon the cost effectiveness of the strategies considered. As disease prevalence increases, the curves flatten, and the same incremental change in prevalence has less impact upon cost effectiveness. In addition, the strategies become much closer in cost effectiveness as the prevalence of cancer increases from the baseline assumption.
Cost of Biopsy and Complications
When the cost of biopsy was varied from $100 up to $1,200, the same strategies were dominant as in the baseline analysis. Assuming a 3% rate of complications, this range of biopsy costs would cover an average cost of complications of up to approximately $30,000.
Sensitivity and Specificity of Clinical Findings
Using the low estimates of sensitivity and specificity of clinical findings, strategy sensitivity ranged from 0.25 to 0.46, specificity from 0.9996 to 0.9777, cost per patient from $14 to $259, and average cost effectiveness ratios from $8,228 to $84,343. Using the high estimates, strategy sensitivity ranged from 0.44 to 0.80, specificity from 0.9997 to 0.9812, cost per patient from $13 to $221, and average cost effectiveness ratios from $4,582 to $41,590.
Other Costs
The strategies that were dominant in the baseline analysis remained dominant for MRI cost between $351 and $1,200, x-ray cost between $10 and $56, and ESR cost between $5 and $33. When the cost of ESR was increased by a $3 venipuncture fee, strategy costs increased by only $1 per patient and $254 to $691 per case found, depending upon the choice of imaging and ESR cutoff point.
DISCUSSION
Cost effectiveness analysis can indicate a set of diagnostic strategies that are dominant in terms of incremental cost effectiveness ratios, but does not provide a criterion for choosing a single best strategy from this set of optimal strategies. The choice of strategy involves a trade-off between sensitivity, specificity, and cost. Policy makers can use cost effectiveness analysis to “maximize the net health benefit for a target population derived from a fixed budget”.37 From the payer's perspective, available resources may dictate the choice of strategy from a set of optimal strategies. However, the physician must act in the best interest of the individual patient. For physician and patient, the goal is to maximize sensitivity while avoiding the discomfort, inconvenience, and risk of unnecessary biopsy.
The most sensitive approach (strategy C) would image everyone with a clinical finding using MRI or bone scan alone; however, this would result in a substantial number of unnecessary biopsies (20.4 per 1,000 patients for MRI, 123 per 1,000 patients for bone scan). When this strategy is applied using serial imaging, the number of unnecessary biopsies is lower (6.1 per 1,000 patients) but still exceeds the number of cases found. Many would consider the incremental cost effectiveness ratios for this strategy prohibitive compared with the next most effective strategy; depending upon the ESR cutoff point, these exceed $218,000 per additional case found when imaging with bone scan, $305,000 with serial imaging, and $454,000 with MRI.
The most specific strategy of serial testing with ESR followed by x-ray, and imaging only if both are positive (strategy F, image if ESR+ and x-ray+), is inexpensive but has poor sensitivity. Fewer than half of cancer cases are found, even with repeat biopsy. In our opinion, better sensitivity is needed.
The algorithm proposed by Deyo and Diehl6(strategy A, selective testing) finds slightly more than half of cancers under baseline assumptions at low cost, and with few unnecessary biopsies; this is a reasonable choice if one is willing to accept the limited sensitivity. We advise an ESR cutoff point of 20 mm/hr for this strategy because of the loss of sensitivity that results from the higher cutoff point. Although this strategy is highly specific, imaging with bone scan alone still results in more unnecessary biopsies (4.6 per 1,000 patients) than cases of cancer found.
Of the strategies considered, we recommend strategies B (image if ESR+ or x-ray+) and B2 (image if HxCa+ or ESR+ or x-ray+) because they offer the best balance between sensitivity and specificity with acceptable cost. For these strategies, we advise the higher ESR cutoff point of 50 mm/hr; in our opinion, the small sacrifice in sensitivity is justified by the marked improvement in specificity and cost effectiveness ratios. The choice between these 2 strategies, and between imaging with MRI or serial imaging, can be based upon whether greater sensitivity or greater specificity is desired (see Table 3). We would not recommend imaging with bone scan alone due to the larger number of unnecessary biopsies (9.6 per 1,000 patients for strategy B, 15.1 for B2).
Our reasoning regarding the choice of imaging gives considerable weight to the number of unnecessary biopsies that result when bone scan alone is used for imaging. Because we did not quantify the patient concern, inconvenience, and discomfort of unnecessary biopsy in our analysis, the higher false-positive rate of bone scan was offset by its lower cost. However, unnecessary biopsy does carry intangible (nonmonetary) costs as well as a small but finite risk of serious complications. For all strategies with sensitivity greater than 50%, unnecessary biopsies exceeded cases found when bone scan alone was used for imaging. Magnetic resonance imaging offers greater specificity than bone scan, with comparable sensitivity and the added advantage of providing anatomic detail in all patients imaged. Serial imaging with bone scan followed by MRI offers the greatest specificity. The choice between these imaging options could also be influenced by considerations that were not included in our decision model. For example, if nonspinal metastases are suspected, then serial imaging might be chosen. If myeloma is suspected based upon clinical presentation, then MRI would be a better choice. Decision models and cost effectiveness analyses provide a framework for clinical decision making but do not relieve the physician of the need to exercise clinical judgement.
Disease prevalence is a critical determinant of cost effectiveness in diagnostic testing. This impact is not only on average cost effectiveness ratios; incremental cost effectiveness ratios are lower at higher disease prevalence. This reflects the essentially reciprocal relationship between disease prevalence and the cost per case detected by a diagnostic test. Liang and Komaroff40 observed a similar effect in their analysis of spinal roentgenograms. At the prevalence of 0.66% for spinal malignancy assumed in our analysis, the cost effectiveness ratios are extremely sensitive to small changes in cancer prevalence.
One may question whether the use of these diagnostic strategies might increase the costs of managing back pain. Using the strategies we have recommended (B and B2) with an ESR cutoff point of 50 mm/hr, 38% to 40% of patients with low back pain would undergo x-ray to look for cancer, including most patients over 50 years of age. This represents a substantial increase in x-ray use over that observed in several outpatient settings. Frazier et al41 found that application of 11 published criteria for spinal x-rays would have increased spinal roentgenogram use from 21% to 46% in a series of outpatients with back pain. Schroth et al.42 used similar criteria and found both underutilization and overutilization of radiography and imaging; however, radiographs were obtained in only 29% of patients with an indication for plain radiography. The effect on levels of utilization would depend upon the practice setting and specialty. Carey et al.43 found marked differences across specialties in the use of spinal radiography and CT or MRI; radiography use ranged from 19% by HMO providers to 72% by orthopedists for an episode of acute low back pain, and Computed Tomography (CT) or MRI use ranged from 6% to 17%.
Our study has certain limitations. We did not consider the costs of treatment or the utilities associated with treatment outcomes; neither did we include the costs associated with missed diagnoses of cancer. Incidental findings on MRI scan, such as disc protrusion not associated with nerve root impingement and disk degeneration, could lead to patient concern, additional care-seeking, and follow-up imaging without significant clinical benefit to the patient. The additional costs associated with such incidental findings were not included in our analysis. The sensitivities of the clinical findings used in the analysis were estimated from small numbers of patients and therefore had wide confidence intervals. Because spinal malignancy includes a diverse group of neoplasms, the test characteristics may not uniformly apply. For certain malignancies (e.g., myeloma) MRI is more sensitive than bone scan. Although we assumed conditional independence of tests, the actual degree of dependence among tests must be established by observation. Studies that focus on this aspect of multiple testing are essential to the construction of accurate decision models.
Current guidelines recommend that cost effectiveness analyses be done from the societal perspective, in which all costs and all health outcomes are taken into account.38 We used Medicare reimbursement as a measure of costs in our analysis; the perspective is therefore that of the payer. This, as well as our use of an intermediate outcome (cases of cancer found), limits the ability to compare the cost effectiveness of these diagnostic strategies with other potential uses of health care resources. Our analysis accounts for only a portion of the cost of evaluating the patient with low back pain. Cancer is 1 of several possible causes of low back pain in primary care patients, and the search for underlying cancer is part of a larger diagnostic algorithm. Despite these limitations, the comparison of strategies in this analysis should complement the broader recommendations for the management of low back pain published in 1994 by the Agency for Health Care Policy and Research12 and provide some insight into the costs associated with the implementation of that guideline.
Are these costs reasonable? This question can only be answered in the context of patient and societal preferences. Studies of mammographic screening for breast cancer have shown cost effectiveness values of $7,000 to $25,500 per case of cancer found,44 and $3,400 to $83,830 per life-year saved.45 Direct comparison with these figures is difficult; unlike metastatic spinal malignancy, breast cancer is often cured by early therapy. Although treatment of spinal metastatic disease will primarily impact upon quality of life rather than survival, these benefits can be substantial. Three-year survival for patients with spinal metastases, measured from the time of bone scan positivity, varies with cancer type but has been shown to be as high as 48% for breast cancer and 56% for prostate cancer.46 The potential gain in quality of life from early treatment to relieve pain and prevent spinal cord compression offers a compelling argument in favor of early diagnosis of spinal malignancy before the onset of neurologic compromise. In our opinion, the associated diagnostic costs are reasonable and justified.
In summary, our baseline analysis identified 5 dominant strategies for finding cancer as a cause of low back pain in primary care patients. Sensitivity analysis identified additional strategies that are optimal in terms of cost, effectiveness, and false-positive rate. We recommend a strategy of imaging patients who have 1 or more clinical finding (history of cancer, age ≥ 50 years, weight loss, or failure to improve with conservative therapy) in combination with either an elevated ESR (>50 mm/hr) or a positive x-ray, or using the same approach but imaging directly without intervening testing those patients with history of cancer. A selective testing algorithm6 that incorporates clinical findings, ESR (>20 mm/hr), and x-ray prior to imaging is a reasonable, although less sensitive, option. Strategy sensitivity can be improved with a modest increase in cost by repeating the biopsy when initially negative. Imaging with MRI, or bone scan followed in series by MRI, leads to fewer unnecessary biopsies than imaging with bone scan alone.
FIGURE 3(B).
Strategy effectiveness versus false positive (unnecessary biopsy) rate for 3 imaging options: MRI (the baseline assumption), bone scan, and bone scan followed in series by MRI. Dominant strategies only are shown for each imaging option. (Note that Strategy C for bone scan, with 4.8 cases found and 122.6 unnecessary biopsies, is not shown). HxCa indicates history of cancer; ESR, erythrocyte sedimentation rate.
Acknowledgments
This project was partially supported by the North Carolina Back Pain Project (Agency for Health Care Policy and Research grant HS06664), the Back Pain Outcome Assessment Team (Agency for Health Care Policy and Research Grants HS06344 and HS08194), and a National Research Service Award through the Primary Care Research Fellowship Program at the University of North Carolina.
REFERENCES
- 1.Deyo RA, Tsui-Wu YJ. Descriptive epidemiology of low-back pain and its related medical care in the United States. Spine. 1987;12:264–8. doi: 10.1097/00007632-198704000-00013. [DOI] [PubMed] [Google Scholar]
- 2.Lawrence VA, Tugwell P, Gafni A, Kosuwon W, Spitzer WO. Acute low back pain and economics of therapy: the iterative loop approach. J Clin Epidemiol. 1992;45:301–11. doi: 10.1016/0895-4356(92)90091-z. [DOI] [PubMed] [Google Scholar]
- 3.Deyo RA. Early diagnostic evaluation of low back pain. J Gen Intern Med. 1986;1:328–38. doi: 10.1007/BF02596214. [DOI] [PubMed] [Google Scholar]
- 4.Frymoyer JW, Cats-Baril WL. An overview of the incidences and costs of low back pain. Orthop Clin North am. 1991;22:263–71. [PubMed] [Google Scholar]
- 5.Deyo RA, Rainville J, Kent DL. What can the history and physical examination tell us about low back pain? JAMA. 1992;268:760–5. [PubMed] [Google Scholar]
- 6.Deyo RA, Diehl AK. Cancer as a cause of back pain: frequency, clinical presentation, and diagnostic strategies. J Gen Intern Med. 1988;3:230–38. doi: 10.1007/BF02596337. [DOI] [PubMed] [Google Scholar]
- 7.Constants JP, DeDivitiis E, Donzelli R, Spaziante R, Meder JF, Haye C. Spinal metastases with neurological manifestations: review of 600 cases. J Neurosurg. 1983;59:111–18. doi: 10.3171/jns.1983.59.1.0111. [DOI] [PubMed] [Google Scholar]
- 8.Bates DW, Reuler JB. Back pain and epidural spinal cord compression. J Gen Intern Med. 1988;3:191–97. doi: 10.1007/BF02596130. [DOI] [PubMed] [Google Scholar]
- 9.Portenoy RK, Lipton RB, Foley KM. Back pain in the cancer patient: an algorithm for evaluation and management. Neurology. 1987;37:134–38. doi: 10.1212/wnl.37.1.134. [DOI] [PubMed] [Google Scholar]
- 10.Sorensen PS, Borgesen SE, Rohde K, et al. Metastatic epidural spinal cord compression: results of treatment and survival. Cancer. 1990;65:1502–08. doi: 10.1002/1097-0142(19900401)65:7<1502::aid-cncr2820650709>3.0.co;2-d. [DOI] [PubMed] [Google Scholar]
- 11.O'Rourke T, George CB, Redmond J, et al. Spinal computed tomography and computed tomographic metrizamide myelography in the early diagnosis of metastatic disease. J Clin Oncol. 1986;4:576–83. doi: 10.1200/JCO.1986.4.4.576. [DOI] [PubMed] [Google Scholar]
- 12.Bigos S, Bowyer O, Braen G, et al. AHCPR publication 95-0642. Rockville, MD: Agency for Health Care Policy and Research, US Dept of Health and Human Services; December 1994. Acute Low Back Problems in Adults. Clinical Practice Guideline No. 14. [Google Scholar]
- 13.Kostuit JP. Differntial diagnosis and surgical treatment of metastatic spinal tumors. In: Frymoyer JW, editor. The Adult Spine: Principles and Practice. 2nd ed. Philadelphia: Lipincott-Raven Publishers; 1997. pp. 989–1014. [Google Scholar]
- 14.Li KC, Poon PY. Sensitivity and specificity of MRI in detecting malignant spinal cord compression and in distinguishing malignant from benign compression fractures of vertebrae. Magn Reson Imaging. 1988;6:547–56. doi: 10.1016/0730-725x(88)90129-4. [DOI] [PubMed] [Google Scholar]
- 15.Godersky JC, Smoker WRK, Knutzon R. Use of magnetic resonance imaging in the evaluation of metastatic spinal disease. Neurosurgery. 1987;21:676–80. doi: 10.1227/00006123-198711000-00013. [DOI] [PubMed] [Google Scholar]
- 16.Sze G. Magnetic resonance imaging in the evaluation of spinal tumors. Cancer. 1991;67:1229–241. doi: 10.1002/1097-0142(19910215)67:4+<1229::aid-cncr2820671520>3.0.co;2-d. [DOI] [PubMed] [Google Scholar]
- 17.Pelz DM, Haddad RG. Radiologic investigation of low back pain. CMAJ. 1989;140:289–95. [PMC free article] [PubMed] [Google Scholar]
- 18.Deyo RA, Bigos SJ, Maravilla KR. Diagnostic imaging procedures for the lumbar spine. Ann Intern Med. 1989;111:865–7. doi: 10.7326/0003-4819-111-11-865. [DOI] [PubMed] [Google Scholar]
- 19.Corcoran RJ, Thrall JH, Kyle RW, Kaminski RJ, Johnson MC. Solitary abnormalities in bone scans of patients with extraosseous malignancies. Radiology. 1976;121:663–7. doi: 10.1148/121.3.663. [DOI] [PubMed] [Google Scholar]
- 20.Pistenma DA, McDougall R, Kriss JP. Screening for bone metastases: are only scans necessary? JAMA. 1975;231:46–50. doi: 10.1001/jama.231.1.46. [DOI] [PubMed] [Google Scholar]
- 21.Waddell G. An approach to backache. Br J Hosp Med. 1982;28:187–219. passim. [PubMed] [Google Scholar]
- 22.Jacobson AF. Musculoskeletal pain as an indicator of occult malignancy: yield of bone scintigraphy. Arch Intern Med. 1997;157:105–9. [PubMed] [Google Scholar]
- 23.Han LJ, Au-Wong TK, Tong WCM, Chu KS, Szeto LT, Wong CP. Comparison of bone single-photon emission tomography and planar imaging in the detection of vertebral metastases in patients with back pain. Eur J Nucl Med. 1998;25:635–8. doi: 10.1007/s002590050266. [DOI] [PubMed] [Google Scholar]
- 24.Avrahami E, Tadmor R, Dally O, Hadar H, Early MR. demonstration of spinal metastases in patients with normal radiographs and CT and radionuclide bone scans. J Comput Assist Tomogr. 1989;13:598–602. doi: 10.1097/00004728-198907000-00008. [DOI] [PubMed] [Google Scholar]
- 25.Gosfield E, Alavi A, Kneeland B. Comparison of radionuclide bone scans and magnetic resonance imaging in detecting spinal metastases. J Nucl Med. 1993;34:2191–8. [PubMed] [Google Scholar]
- 26.Mazanec DJ. Low back pain syndromes. In: Black ER, Bordley DR, Tape TG, Panzer RJ, editors. Diagnostic Strategies for Common Medical Problems. 2nd ed. Philadelphia: American College of Physicians; 1999. pp. 401–18. [Google Scholar]
- 27.Collins JD, Bassett L, Main GD, Kagan C. Percutaneous biopsy following positive bone scans. Radiology. 1979;132:439–42. doi: 10.1148/132.2.439. [DOI] [PubMed] [Google Scholar]
- 28.Schajowicz F, Derqui JC. Puncture biopsy in lesions of the locomotor system: review of results in 4050 cases, including 941 vertebral punctures. Cancer. 1968;21:531–48. doi: 10.1002/1097-0142(196803)21:3<531::aid-cncr2820210325>3.0.co;2-#. [DOI] [PubMed] [Google Scholar]
- 29.Fyfe IS, Henry APJ, Mulholland RC. Closed vertebral biopsy. J Bone Joint Surg. 1983;65-B:140–3. doi: 10.1302/0301-620X.65B2.6826616. [DOI] [PubMed] [Google Scholar]
- 30.Ackermann W. Application of the trephine for bone biopsy: results in 635 cases. JAMA. 1963;184:11–7. doi: 10.1001/jama.1963.03700140067009. [DOI] [PubMed] [Google Scholar]
- 31.Babu NV, Titus VTK, Chittaranjan S, Abraham G, Prem H, Korula RJ. Computed tomographically guided biopsy of the spine. Spine. 1994;19:2436–442. doi: 10.1097/00007632-199411000-00013. [DOI] [PubMed] [Google Scholar]
- 32.Kornblum MB, Wesolowski DP, Fischgrund JS, Herkowitz HN. Computed tomography guided biopsy of the spine: a review of 103 patients. Spine. 1998;23:81–5. doi: 10.1097/00007632-199801010-00018. [DOI] [PubMed] [Google Scholar]
- 33.Stoker DJ, Kissin CM. Percutaneous vertebral biopsy: a review of 135 cases. Clin Radiol. 1985;36:569–77. doi: 10.1016/s0009-9260(85)80235-x. [DOI] [PubMed] [Google Scholar]
- 34.Moore TM, Meyers MH, Patzakis MJ, Terry R, Harvey JP. Closed biopsy of musculoskeletal lesions. J Bone Joint Surg. 1979;61-A:375–80. [PubMed] [Google Scholar]
- 35.Health Care Financing Administration Medicare Physician Fee Schedule and clinical diagnostic laboratory fee schedule. Available at http://www.hcfa.gov/stats/pufiles.htm.
- 36.Eisenberg JM. Clinical economics: a guide to the economic analysis of clinical practices. JAMA. 1989;262:2879–86. doi: 10.1001/jama.262.20.2879. [DOI] [PubMed] [Google Scholar]
- 37.Detsky AS, Naglie IG. A clinician's guide to cost effectiveness analysis. Ann Intern Med. 1990;113:147–54. doi: 10.7326/0003-4819-113-2-147. [DOI] [PubMed] [Google Scholar]
- 38.Siegel JE, Weinstein MC, Torrance GW. Reporting cost effectiveness studies and results. In: Gold MR, Siegel JE, Russell LB, Weinstein MC, editors. Cost effectiveness in Health and Medicine. New York: Oxford University Press; 1996. pp. 276–303. [Google Scholar]
- 39.Brandeau ML, Eddy DM. The workup of the asymptomatic patient with a positive fecal occult blood test. Med Decis Making. 1987;7:46. doi: 10.1177/0272989X8700700108. [DOI] [PubMed] [Google Scholar]
- 40.Liang M, Komaroff AL. Roentgenograms in primary care patients with acute low back pain: a cost effectiveness analysis. Arch Intern Med. 1982;142:1108–12. [PubMed] [Google Scholar]
- 41.Frazier LM, Carey TS, Lyles MF, Khayrallah MA, McGaghie WC. Selective criteria may increase lumbosacral spine roentgenogram use in acute low-back pain. Arch Intern Med. 1989;149:47–50. [PubMed] [Google Scholar]
- 42.Schroth WS, Schectman JM, Elinsky EG, Panagides JC. Utilization of medical services for the treatment of acute low back pain: conformance with clinical guidelines. J Gen Intern Med. 1992;7:486–91. doi: 10.1007/BF02599449. [DOI] [PubMed] [Google Scholar]
- 43.Carey TS, Garrett JG, Jackman A, et al. The outcomes and costs of care for acute low back pain among patients seen by primary care practitioners, chiropractors, and orthopedic surgeons. N Engl J Med. 1995;333:913–17. doi: 10.1056/NEJM199510053331406. [DOI] [PubMed] [Google Scholar]
- 44.Evens RG. Diagnostic imaging in cancer care: the role of cost/benefit analysis. Cancer. 1991;67:1245–52. doi: 10.1002/1097-0142(19910215)67:4+<1245::aid-cncr2820671522>3.0.co;2-h. [DOI] [PubMed] [Google Scholar]
- 45.Brown ML, Fintor L. Cost effectiveness of breast cancer screening: preliminary results of a systematic review of the literature. Breast Cancer Res and Treat. 1993;25:113–18. doi: 10.1007/BF00662136. [DOI] [PubMed] [Google Scholar]
- 46.Tatsui H, Onomura T, Morishita S, Oketa M, Inoue T. Survival rates of patients with metastatic spinal cancer after scintigraphic detection of abnormal radioactive accumulation. Spine. 1996;21:2143–8. doi: 10.1097/00007632-199609150-00017. [DOI] [PubMed] [Google Scholar]


