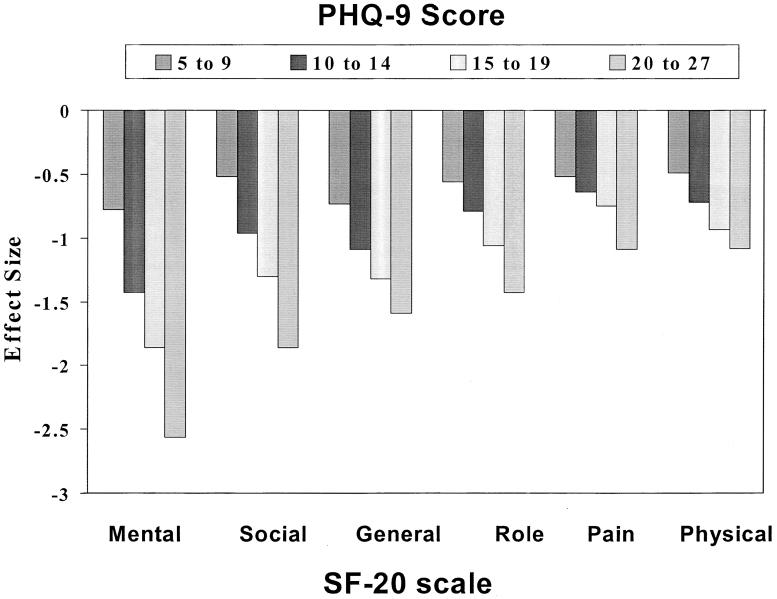
Figure 1.
Relationship between depression severity as measured by the PHQ-9 and decline in functional status as measured by the 6 subscales of the SF-20. The decrement in SF-20 scores are shown as the difference between each PHQ-9 severity group and the nondepressed reference group (i.e., those with PHQ-9 scores of 0 to 4). Effect size is the difference in group means divided by the standard deviation of the entire sample.

