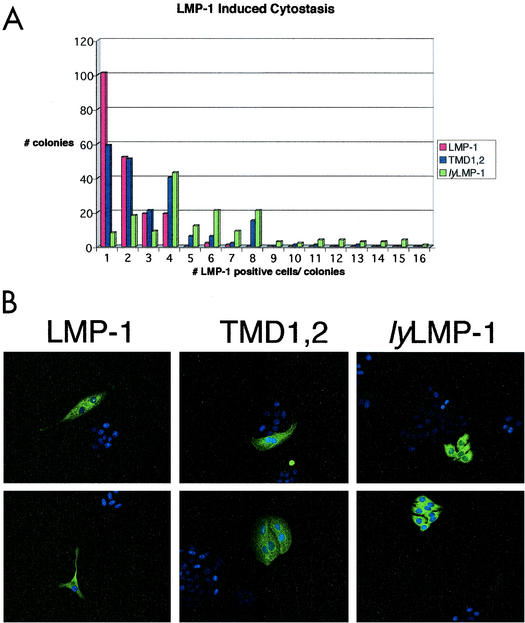
FIG. 3.
TMD1,2-induced cytostasis. HEp2 cells were transfected with pCMV-LMP-1, pCMV-TMD1,2, or pCMV-lyLMP-1 and plated on coverslips at clonal density immediately following transfection. Four days postplating, cells were fixed and stained with anti-LMP-1 antiserum. (A) All colonies on a given coverslip were scored for the number of positive cells (LMP-1 immunoreactive) and data are expressed as number of positive cells per colony. Data shown as “1 LMP-1-positive cell per colony” include both individual immunoreactive cells (see part B, LMP-1) and single immunoreactive cells within a colony (see upper panel in part B, TMD1,2). A total of 500 colonies were scored for each transfection. (B) Immunofluorescent images of representative colonies are shown for each transfection; two representative images are shown for each of the introduced plasmids; the name of the introduced plasmid is shown above each equivalent set of images (upper and lower panels). These results are representative of three separate experiments. Both LMP-1- and TMD1,2-positive HEp2 colonies primarily have one to four LMP-1-immunoreactive cells, whereas lyLMP-1-positive colonies primarily have four to eight immunoreactive cells. LMP-1- and TMD1,2-positive cells tend to be multinucleated and much larger than lyLMP-1-positive cells.

