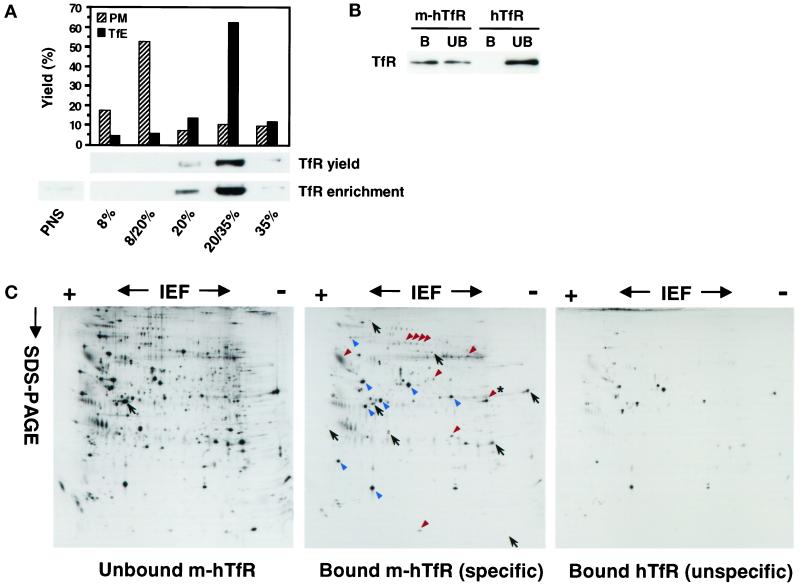
Figure 2.
Purification of TfR-positive endosomes. (A) Lower panel, PNSs prepared from cells expressing m-hTfR were fractionated on a discontinuous sucrose gradient loaded with 8, 20, and 35% sucrose. After centrifugation, fractions were collected and analyzed by SDS-PAGE and Western blotting with the use of anti-TfR antibodies as in Figure 1A. Lanes were loaded with either the same amount of protein (enrichment) or 10% of the volume (yield) of each fraction. Upper panel, To label the plasma membrane (PM), Tf-HRP was bound to the surface of m-hTfR cells at 4°C. To label recycling endosomes (TfE), Tf-HRP was bound to the surface of m-hTfR cells at 4°C and internalized for 10 min at 37°C. PNSs were prepared and fractionated, and the HRP content of the fractions was quantified. (B) Membranes enriched in m-hTfR were prepared with the use of the sucrose gradient, as in A, and further fractionated by immunoisolation with the 9E10 mAb against the myc tag and magnetic beads. As a control for nonspecific binding, the whole purification procedure was carried out in parallel with hTfR cells. Beads were retrieved with a magnet, and then both bound material (B) and unbound material sedimented at 150,000 × g for 30 min (UB) were analyzed for TfR content by Western blotting as in Figure 1A. (C) The purification protocol was carried out as in B with the use of m-hTfR and hTfR cells that had been metabolically labeled with [35S]Met, and samples were analyzed by high-resolution two-dimensional gel electrophoresis followed by autoradiography. The general protein pattern of the immunoisolated fraction [Bound m-hTfR (specific)] was compared with that of the unbound material sedimented at 150,000 × g for 30 min [Unbound m-hTfR] to determine which proteins were specifically immunoisolated (examples are indicated with red arrowheads). The asterisk indicates the position of flotillin-1 in the same gel system. Examples of proteins that were not isolated are indicated with black arrows. Contaminants (blue arrowheads) were determined by comparison with samples from hTfR cells [Bound hTfR (unspecific)]. The position of actin, which is commonly used for orientation in this type of analysis, is indicated on the unbound m-hTfR gel.

